You're juggling 5 tools.
Or worse, you have nothing.
Uptime Kuma for HTTP, Healthchecks for crons, Grafana+Prometheus for metrics, an SSL checker, and bash scripts. None of them see the full picture.
Before — fragmented monitoring
- ✕ Uptime Kuma — HTTP checks only
- ✕ Healthchecks.io — heartbeats only
- ✕ Grafana + Prometheus + cAdvisor — 3 containers
- ✕ Separate SSL checker
- ✕ No unified view
- ✕ 5 dashboards, 5 configs, 5 maintenances
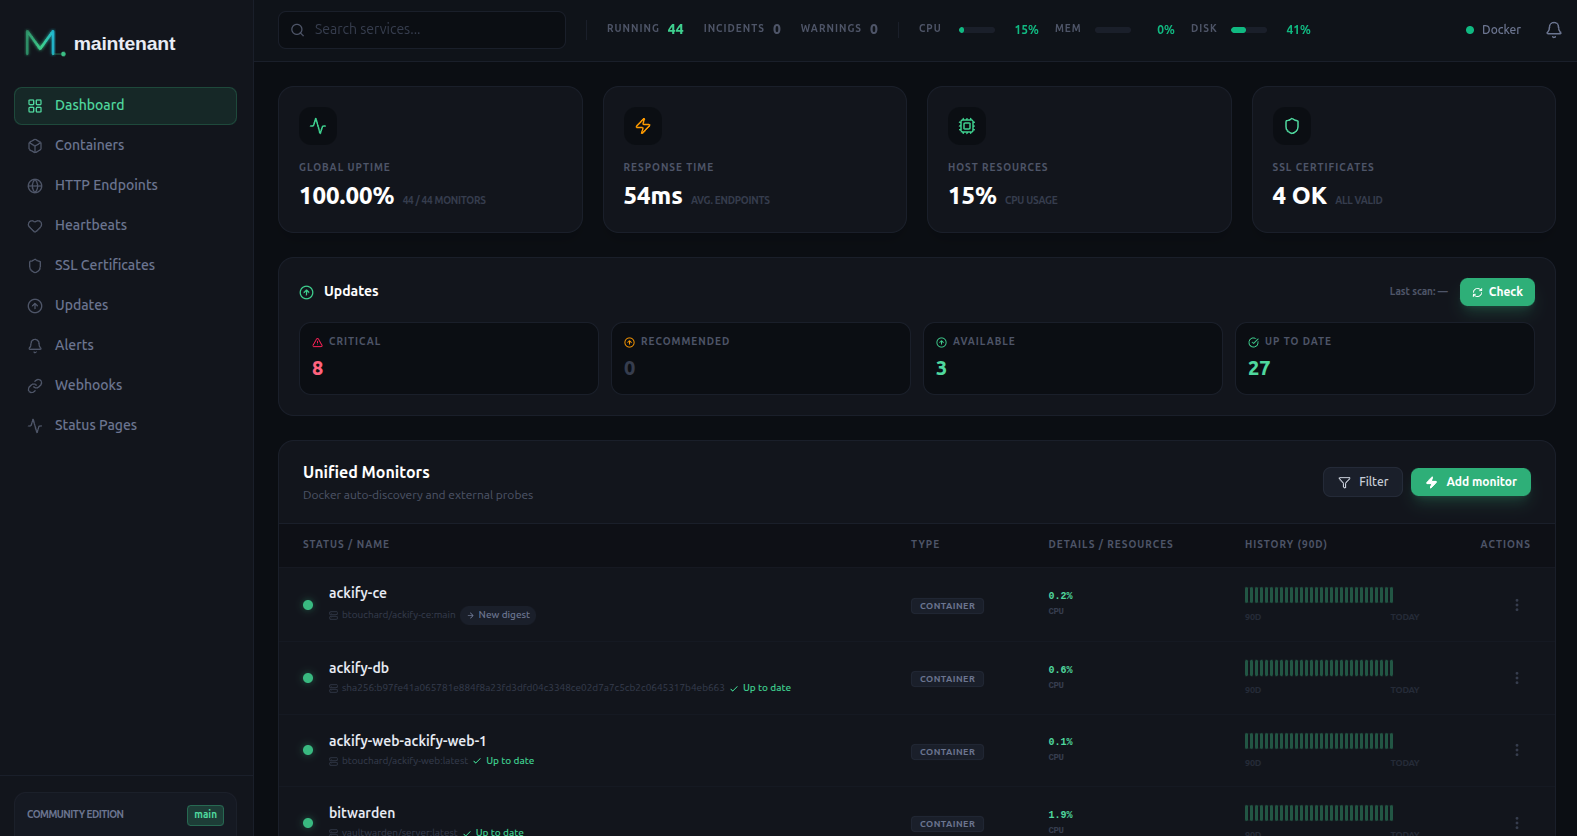
After — Maintenant
- ✓ Auto-discovered containers (Docker + K8s)
- ✓ HTTP/TCP endpoints monitored
- ✓ Cron jobs and heartbeats tracked
- ✓ SSL certificates validated automatically
- ✓ CPU, RAM, network, disk metrics
- ✓ One container. One dashboard. Everything's here.
Everything you need.
Nothing more.
Containers
Docker and Kubernetes auto-discovery. States, health checks, restart loops, logs. Compose projects grouped automatically.
HTTP/TCP Endpoints
Active probing with latency, status codes, content assertions. Configure via Docker labels — zero YAML files.
Heartbeats / Cron
Unique ping URL per job. Track durations, exit codes, and get alerted when a cron doesn't run.
SSL/TLS Certificates
Automatic detection on your HTTPS endpoints. Expiration alerts at 30, 14, 7, 3, 1 day. Full chain validation.
System Resources
CPU, RAM, network and disk I/O — per container and per host. Real-time charts with configurable threshold alerts.
Update Intelligence
Detects available updates via OCI scan. Compare digests across all your containers. Stop blind docker pull.
Unified Alerts
Webhook and Discord built-in. Pro Slack, Teams, Email, escalation, routing, and custom templates.
Status Page
Real-time public page for your users. Component groups, live SSE updates. Pro Incident management, maintenance windows, subscriber notifications.
REST API + MCP
Full API under /api/v1/. Real-time SSE streams. Built-in MCP server to query your infra from an AI assistant.
Operational in 30 seconds
Deploy
Add Maintenant to your docker-compose.yml. Mount the Docker socket read-only. That's it.
docker compose up -dAuto-discovery
Maintenant detects your containers, their health checks, Compose projects. On Kubernetes, it detects the runtime automatically.
5 containers discoveredMonitor and alert
Add Docker labels for HTTP/TCP endpoints. Configure your Discord or Slack webhooks. Your stack is under control.
0 incidents · 99.98% uptimeCopy. Paste. Monitor.
# docker-compose.yml
services:
  maintenant:
    image: ghcr.io/kolapsis/maintenant:latest
    ports:
      - "8080:8080"
    volumes:
      - /var/run/docker.sock:/var/run/docker.sock:ro
      - maintenant-data:/data
    environment:
      MAINTENANT_DB: "/data/maintenant.db"
    restart: unless-stopped
volumes:
  maintenant-data:
Compatible with Docker Engine 20.10+ and Kubernetes · Linux amd64/arm64 · macOS · WSL2
One tool instead of five
| Maintenant | Uptime Kuma | Grafana Stack | Healthchecks | Portainer | |
|---|---|---|---|---|---|
| Container auto-discovery | ✓ | — | — | — | ✓ |
| HTTP/TCP Checks | ✓ | ✓ | ✓ | — | — |
| Heartbeats / Cron | ✓ | ✓ | — | ✓ | — |
| SSL Monitoring | ✓ | ✓ | — | — | — |
| CPU/RAM/Network metrics | ✓ | — | ✓ | — | Limited |
| Update detection | ✓ | — | — | — | ✓ |
| Public status page | ✓ | ✓ | — | — | — |
| Native Kubernetes | ✓ | — | ✓ | — | ✓ |
| Single binary, zero deps | ✓ | Node.js | 3+ containers | Python | — |
Simple. Transparent.
100% on-premise. Your data stays with you. Always.
- ✓ Unlimited container auto-discovery
- ✓ HTTP/TCP endpoint monitoring
- ✓ Heartbeats / cron (10 max)
- ✓ SSL/TLS certificates
- ✓ CPU, RAM, network metrics
- ✓ Update Intelligence (digest scan)
- ✓ Webhook + Discord
- ✓ Public status page
- ✓ REST API + SSE + MCP
- ✓ PWA
- ✓ Everything in Community
- ✓ Unlimited heartbeats
- ✓ Slack, Teams, Email
- ✓ Alert escalation and routing
- ✓ Custom alert templates
- ✓ Maintenance windows
- ✓ CVE enrichment + risk score
- ✓ Incident management
- ✓ Subscriber notifications
- ✓ Priority email support
Install Maintenant, then activate Pro from the interface
Your stack deserves
to be monitored.
One container. Zero config. Install Maintenant and take back control.