The monitoring industry has a complexity addiction. Prometheus needs cAdvisor, Grafana, node_exporter, and Alertmanager. Datadog needs an agent plus a SaaS account. Netdata needs 300+ MB of RAM. Even “simple” tools like Uptime Kuma need Node.js and a separate database.
There is a better way.
What “Single Binary” Actually Means
A single-binary monitoring tool ships as one executable file. No runtime dependencies. No external database. No separate frontend server. Everything — the monitoring engine, the web interface, the database, the alert system — is compiled into one artifact.
In Docker terms: one image, one container, one volume. That is it.
services:
  maintenant:
    image: ghcr.io/kolapsis/maintenant:latest
    ports:
      - "8080:8080"
    volumes:
      - /var/run/docker.sock:/var/run/docker.sock:ro
      - /proc:/host/proc:ro
      - maintenant-data:/data
    restart: unless-stopped
No postgres container. No redis container. No nginx reverse proxy in front of it. No separate worker processes.
Why It Matters for Self-Hosters
Fewer failure modes
Every additional component in your monitoring stack is a potential failure point. Prometheus can crash independently of Grafana. Your Alertmanager config can desync from your Prometheus rules. cAdvisor can OOM while Grafana keeps showing stale data.
With a single binary, either the whole thing works or it does not. There is no partial failure state to debug.
Resource efficiency
Maintenant uses <30 MB of RAM at idle. Compare that to a typical Grafana stack:
| Component | RAM (idle) |
|---|---|
| Prometheus | 150-300 MB |
| Grafana | 100-200 MB |
| cAdvisor | 100-200 MB |
| node_exporter | 20-50 MB |
| Alertmanager | 30-50 MB |
| Total | 400-800 MB |
| Maintenant | <30 MB |
On a 2 GB VPS, that is the difference between having room for your actual services and fighting for memory.
Zero configuration
A single binary can ship with sane defaults for everything because it controls the entire stack. There is no prometheus.yml to write, no Grafana datasource to configure, no Alertmanager routing tree to design.
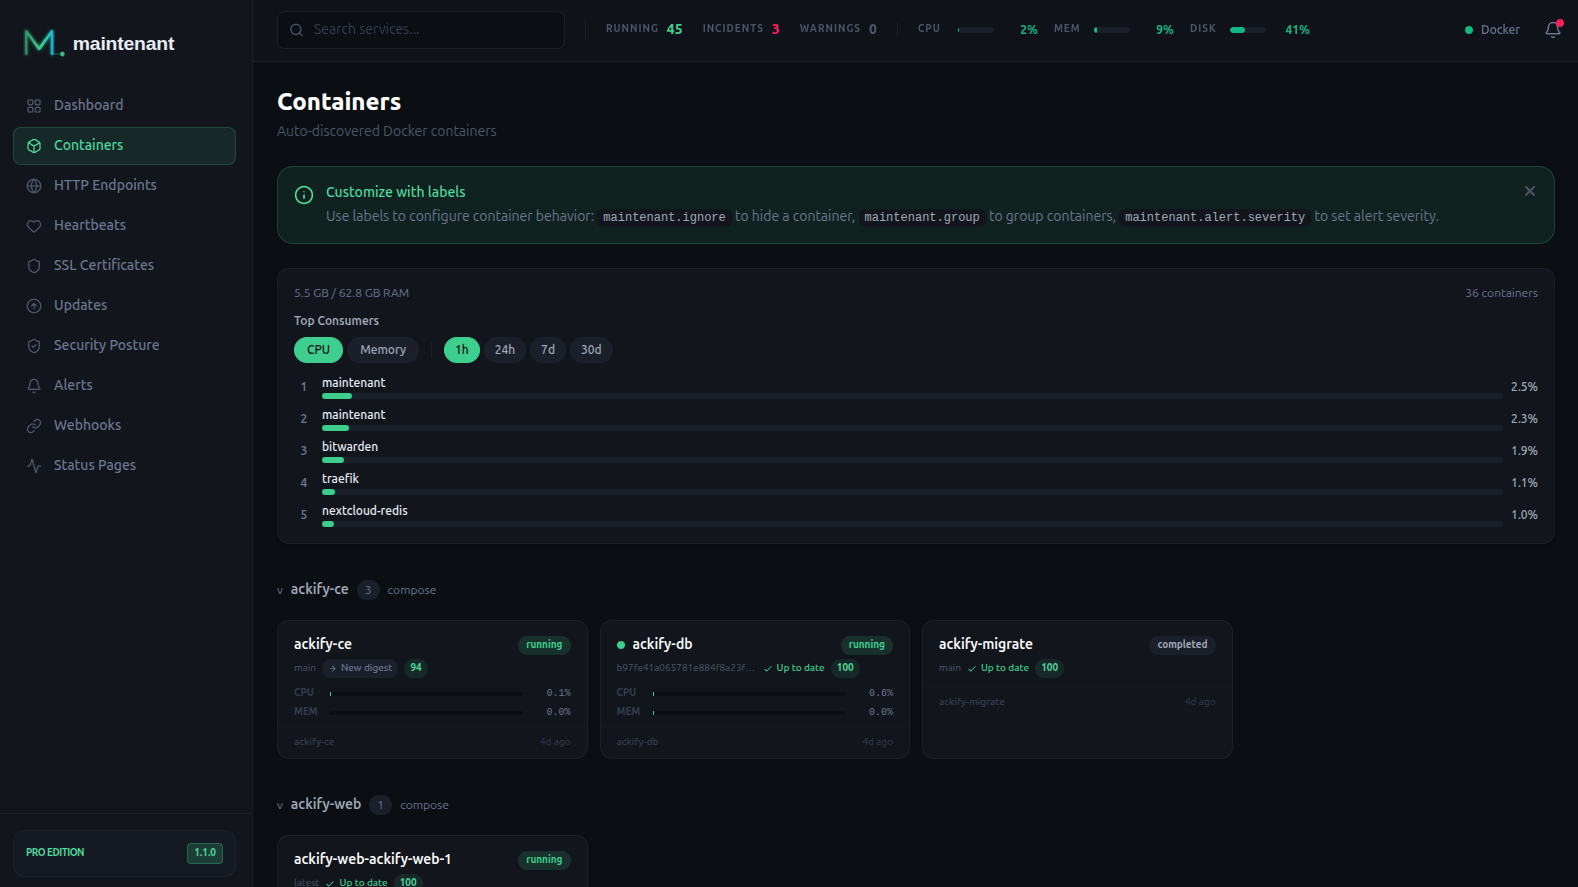
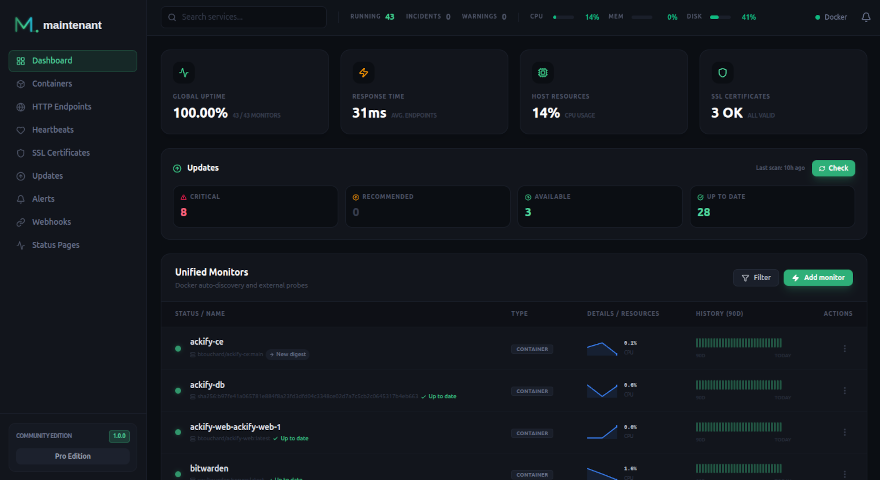
Maintenant connects to the Docker socket, discovers your containers, and starts monitoring. The only “configuration” is Docker labels on your services for HTTP endpoint checks.
Simpler backups
One SQLite file in one volume. Back it up however you back up your other volumes. No pg_dump, no separate Prometheus TSDB snapshots, no Grafana dashboard exports.
Simpler updates
docker compose pull && docker compose up -d
One image to pull. One container to restart. No version compatibility matrix between Prometheus, Grafana, and their respective plugins.
The Trade-offs
Single-binary tools are opinionated by nature. You trade flexibility for simplicity:
- No custom dashboards — the views are pre-built
- No plugin ecosystem — what ships is what you get
- No custom query language — no PromQL equivalent
- Scaling limits — one binary per host or cluster, not a distributed system
For 95% of self-hosted Docker stacks, these trade-offs are a feature, not a limitation.
The Go Advantage
Most single-binary monitoring tools are written in Go, and for good reason:
- Static compilation — no runtime dependencies, no shared libraries
- Low memory footprint — goroutines are cheap, garbage collection is efficient
- Cross-compilation — one build produces binaries for linux/amd64, linux/arm64, macOS
- Embedded assets —
embed.FSallows shipping the entire frontend inside the binary
Maintenant embeds its web UI, its SQLite database engine, and all monitoring logic in a single ~20 MB binary.
When to Choose a Single-Binary Tool
Choose a single-binary monitoring tool if you:
- Self-host on 1-5 servers
- Run Docker Compose or single-node Kubernetes
- Want monitoring that “just works” without configuration
- Value simplicity over infinite customizability
- Have limited RAM (1-4 GB VPS)
If you manage hundreds of servers across multiple cloud providers and need custom dashboards with ad-hoc queries, a distributed monitoring stack (Prometheus/Grafana, Datadog, etc.) is the right tool for the job.
For everyone else, a single binary is enough.