The monitoring industry has a complexity addiction. Prometheus needs cAdvisor, Grafana, node_exporter and Alertmanager. Datadog needs an agent plus a SaaS account. Even “simple” tools like Uptime Kuma need Node.js and a separate database.
That stopped being the only option. The landscape in 2026 looks very different from five years ago: SaaS monitoring costs have climbed to where Datadog bills regularly exceed hosting costs for small teams, and self-hosted tools have matured to the point where a single Go binary replaces a five-container stack.
What “single binary” actually means
A single-binary monitoring tool ships as one executable file. No runtime dependencies, no external database, no separate frontend server. The monitoring engine, the web interface, the database and the alert system are compiled into one artifact.
In Docker terms: one image, one container, one volume.
services:
  maintenant:
    image: ghcr.io/kolapsis/maintenant:latest
    ports:
      - "8080:8080"
    volumes:
      - /var/run/docker.sock:/var/run/docker.sock:ro
      - /proc:/host/proc:ro
      - maintenant-data:/data
    environment:
      MAINTENANT_ADDR: "0.0.0.0:8080"
      MAINTENANT_DB: "/data/maintenant.db"
    restart: unless-stopped
volumes:
  maintenant-data:
No Postgres container. No Redis container. No nginx in front of it. No separate worker processes.
What changed
Three trends converged:
- Go’s
embed.FSmade it trivial to ship a full web UI inside a single binary. No separate frontend server needed. - SQLite’s WAL mode proved that an embedded database handles real-time monitoring workloads without PostgreSQL or InfluxDB.
- Docker’s dominance in self-hosting meant tools could assume a container runtime and skip the “works on bare metal, VMs, containers and Kubernetes” complexity.
The result is a generation of monitoring tools radically simpler than their predecessors.
| Old way (2020) | New way (2026) | |
|---|---|---|
| Architecture | Prometheus + Grafana + cAdvisor + Alertmanager | Single binary |
| Database | InfluxDB or Prometheus TSDB | Embedded SQLite |
| Frontend | Separate React/Angular app | Embedded via embed.FS |
| Config | prometheus.yml + grafana.ini + alertmanager.yml | Zero (auto-discovery) |
| RAM | 500+ MB combined | about 100 MB |
| Setup time | 1-2 hours | 30 seconds |
Why self-hosted matters more than ever
Data sovereignty
Data residency regulations have only got stricter. GDPR, DORA, NIS2 — the acronyms keep multiplying. Sending infrastructure data to a US-based SaaS provider is a compliance headache even for small companies.
A self-hosted tool keeps your monitoring data on your server, inside your network.
Cost
Per-host, per-GB, per-custom-metric pricing means costs scale faster than your infrastructure. A startup running 30 containers can easily spend $20,000+/year on monitoring alone. A self-hosted single binary costs the compute it runs on: effectively zero marginal cost.
Independence
SaaS monitoring creates a dependency on someone else’s infrastructure. When the provider has an outage, your monitoring goes down while your actual services keep running. The irony is thick. Self-hosted monitoring fails only when your own infrastructure fails, which is exactly when you need it most — with one caveat covered below.
Why one binary, specifically
Fewer failure modes
Every additional component is a potential failure point. Prometheus can crash independently of Grafana. An Alertmanager config can desync from its Prometheus rules. cAdvisor can OOM while Grafana keeps showing stale data.
With a single binary, either the whole thing works or it does not. There is no partial failure state to debug.
Resource efficiency
| Component | RAM |
|---|---|
| Prometheus | 150-300 MB |
| Grafana | 100-200 MB |
| cAdvisor | 100-200 MB |
| node_exporter | 20-50 MB |
| Alertmanager | 30-50 MB |
| Total | 400-800 MB |
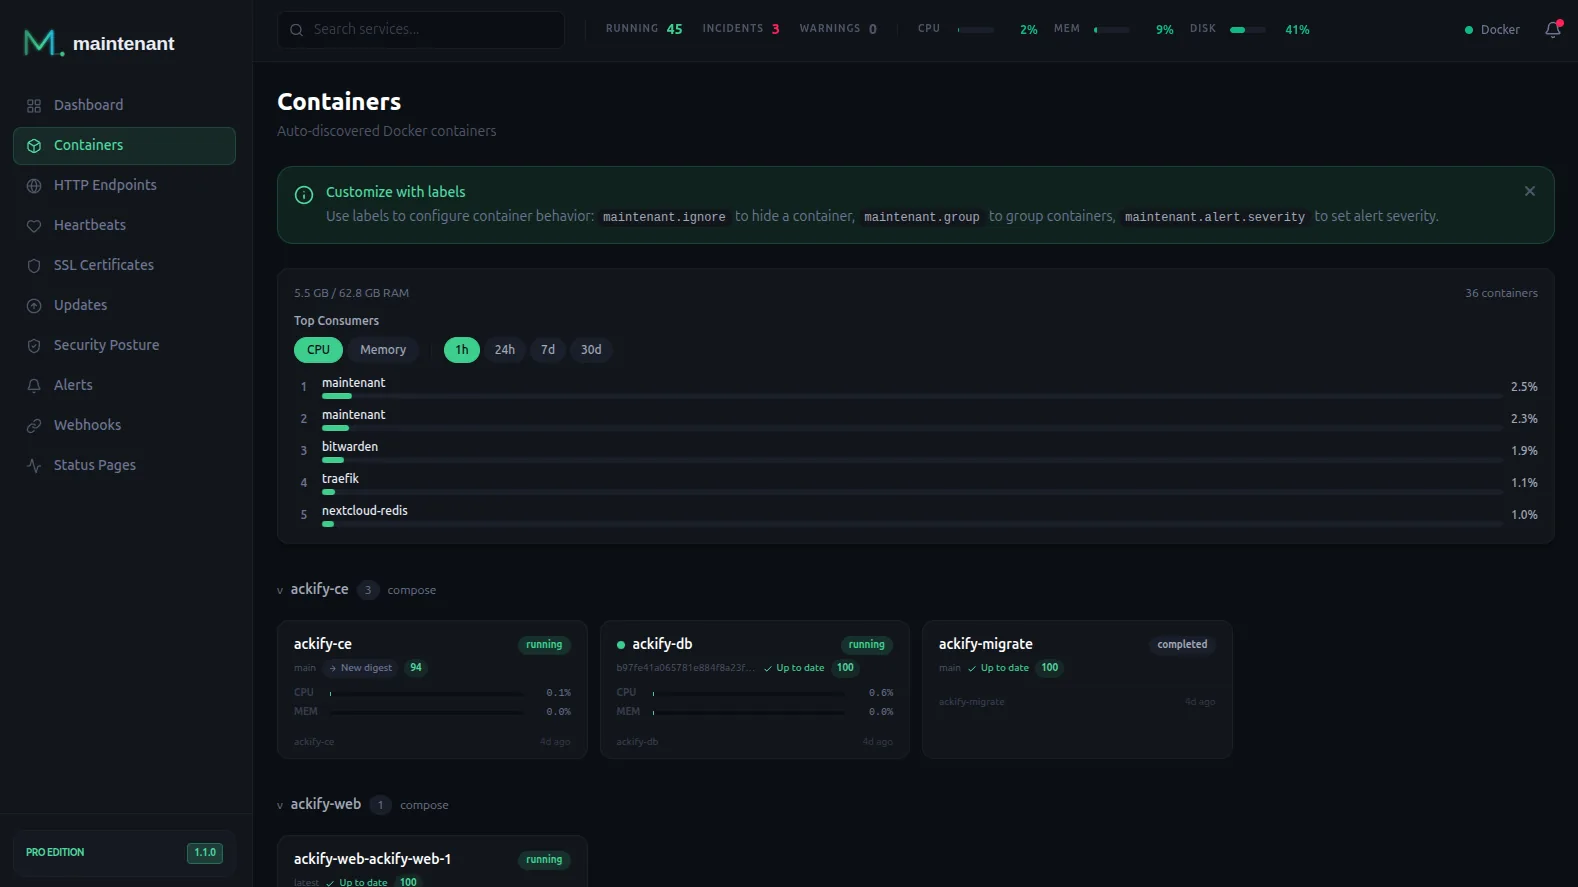
| Maintenant | about 100 MB |
On a 2 GB VPS, that is the difference between having room for your actual services and fighting for memory.
Zero configuration
A single binary ships with sane defaults for everything because it controls the entire stack. There is no prometheus.yml to write, no Grafana datasource to configure, no Alertmanager routing tree to design. Maintenant connects to the Docker socket, discovers your containers, and starts monitoring.
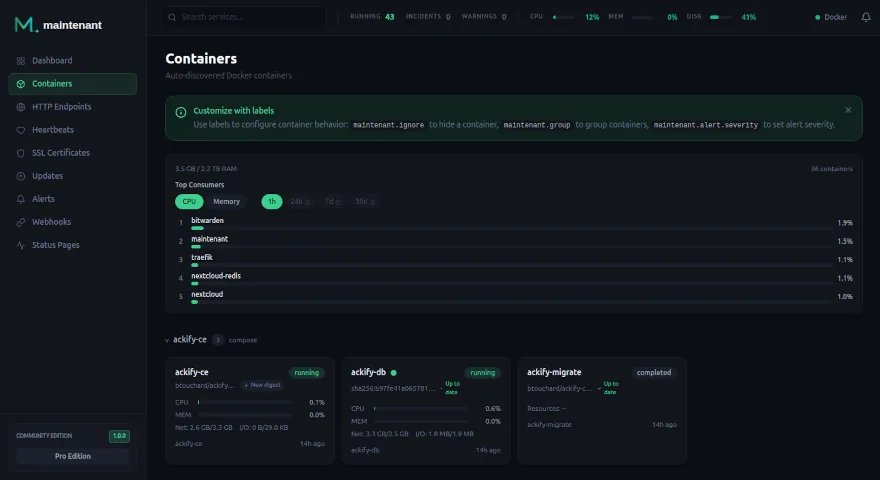
The only configuration is Docker labels on your own services:
labels:
  maintenant.endpoint.http: "http://api:3000/health"
  maintenant.endpoint.interval: "30s"
Monitoring configuration lives with your code. Versioned, reproducible, and it does not require a separate UI.
Simpler backups and updates
One SQLite file in one volume. Back it up the way you back up your other volumes — no pg_dump, no TSDB snapshots, no dashboard exports. Updating is docker compose pull && docker compose up -d: one image, one container, no version compatibility matrix between Prometheus, Grafana and their plugins.
Unified coverage
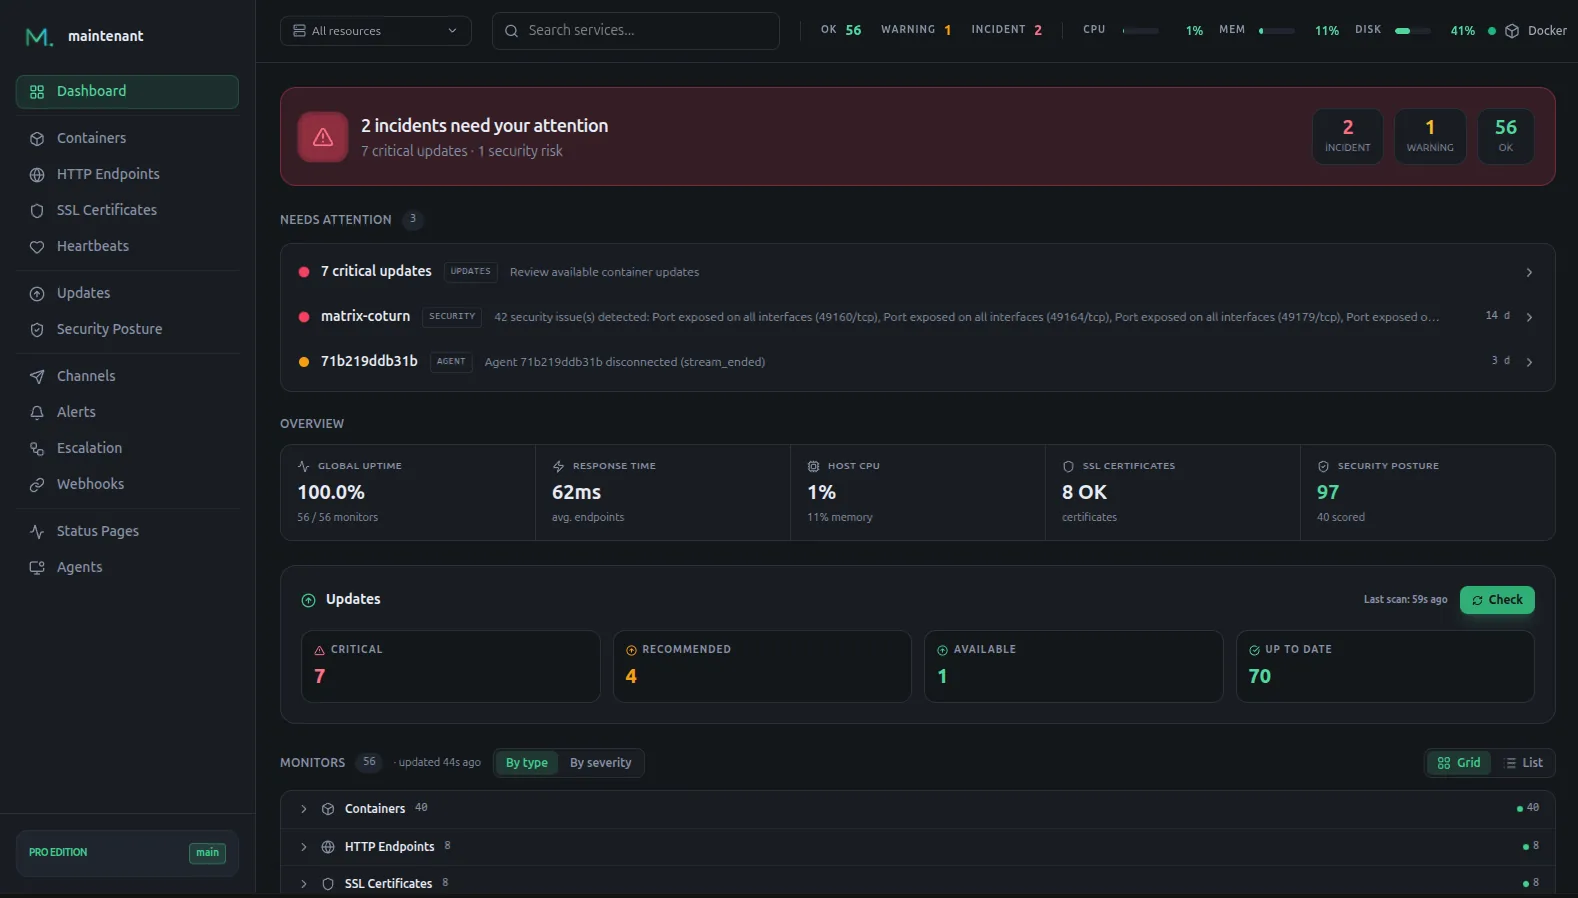
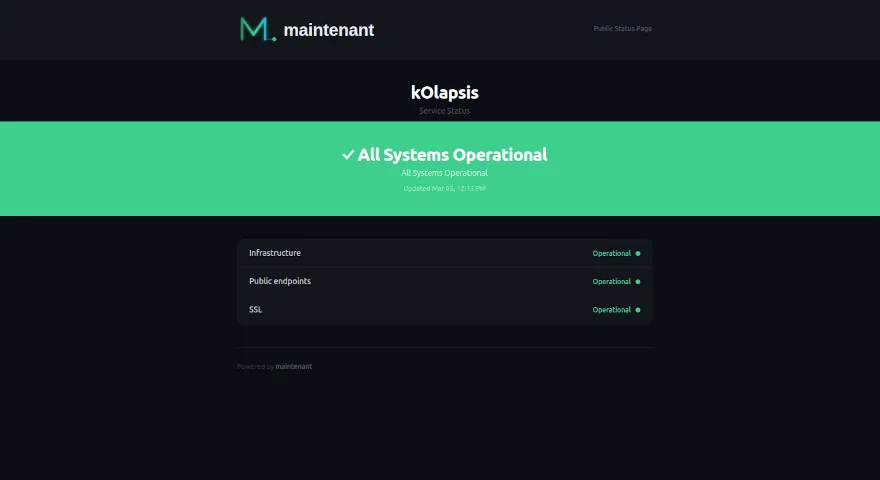
One tool covers containers, HTTP/TCP endpoints, SSL certificates, cron jobs, system resources and update detection. Alerts and a public status page are included rather than bolted on as separate services.
The Go advantage
Most single-binary monitoring tools are written in Go, for good reasons:
- Static compilation: no runtime dependencies, no shared libraries.
- Modest memory use: goroutines are cheap, garbage collection is efficient.
- Cross-compilation: one build produces linux/amd64 and linux/arm64 binaries.
- Embedded assets:
embed.FSships the entire frontend inside the binary.
Maintenant embeds its web UI, its SQLite engine and all monitoring logic in a single ~20 MB binary.
The trade-offs
Single-binary tools are opinionated by nature. You trade flexibility for simplicity:
- No distributed tracing. If you need OpenTelemetry-level observability, this is the wrong class of tool.
- No infinite retention. Embedded SQLite is not a time-series database tuned for years of data.
- No custom dashboards and no query language. The views are pre-built; there is no PromQL equivalent and no plugin ecosystem.
- Scaling limits. One central server with lightweight agents on remote hosts, not a distributed system. Multi-region aggregation remains the domain of distributed stacks.
- One host to lose. If the machine running it dies, monitoring dies with it. Run it somewhere separate from the infrastructure it watches.
When to choose one
Choose a single-binary monitoring tool if you self-host on one to five servers, run Docker Compose or single-node Kubernetes, want monitoring that works without configuration, value simplicity over customisability, or have limited RAM on a small VPS.
If you manage hundreds of servers across multiple cloud providers and need custom dashboards with ad-hoc queries, a distributed stack is the right tool for the job. For everyone else, one binary is enough.
Install Maintenant: self-hosted monitoring for Docker and Kubernetes → · Compare editions →