Grafana + Prometheus is the gold standard monitoring stack. It is powerful, flexible, and backed by a massive community. For large-scale infrastructure managed by dedicated SRE teams, it is often the right call.
But for a stack of 10-50 containers running on a VPS? That is like bringing a bulldozer to plant a flower.
This is the comparison. For the replacement-focused version with the full feature table, see the Prometheus + Grafana alternative page; for the step-by-step move, see the migration guide.
The Real Cost of the Grafana Stack
To monitor your Docker containers with Grafana, you need at minimum:
- Prometheus – metrics collection and storage
- cAdvisor – exposes container metrics to Prometheus
- Grafana – visualization and dashboards
- node_exporter – host system metrics (optional but recommended)
- Alertmanager – alert management (if you want notifications)
That is five extra containers just to monitor the containers you already have. Each one comes with its own configuration, its own updates, and its own potential issues.
The irony: your monitoring stack can go down independently of your applications. And who monitors the monitoring?
The Learning Curve
PromQL is a powerful query language. It is also a query language you will need to learn. Writing an alert rule for “my Redis container is using more than 80% of its allocated memory” requires a query like:
container_memory_usage_bytes{name="redis"} /
container_spec_memory_limit_bytes{name="redis"} > 0.8
With Maintenant, you set the threshold on the container, in the interface or through the API:
curl -X PUT http://localhost:8080/api/v1/containers/{id}/resources/alerts \
  -H "Content-Type: application/json" \
  -d '{"cpu_threshold": 90, "mem_threshold": 80, "enabled": true}'
No query language: the alert fires once memory stays above 80% of the limit for two samples in a row.
What Maintenant Does NOT Do
Let’s be honest. Maintenant is not a drop-in replacement for Grafana + Prometheus in every scenario:
- No ad-hoc queries – Maintenant has no equivalent to PromQL for freely exploring data
- No custom dashboards – views are pre-built and opinionated
- No long-term retention – fixed windows only: 1h · 6h · 24h · 7d on Community, 1h · 6h · 24h · 7d · 30d on Personal, 1h · 6h · 24h · 7d · 30d · 90d on Pro, far-end granularity 1 day (Prometheus can store years of data)
- No multi-cluster federation – one Maintenant server, with agents on remote hosts from Personal, not a federation of metric stores
If you need any of these capabilities, stick with Grafana + Prometheus.
When Maintenant Is the Right Choice
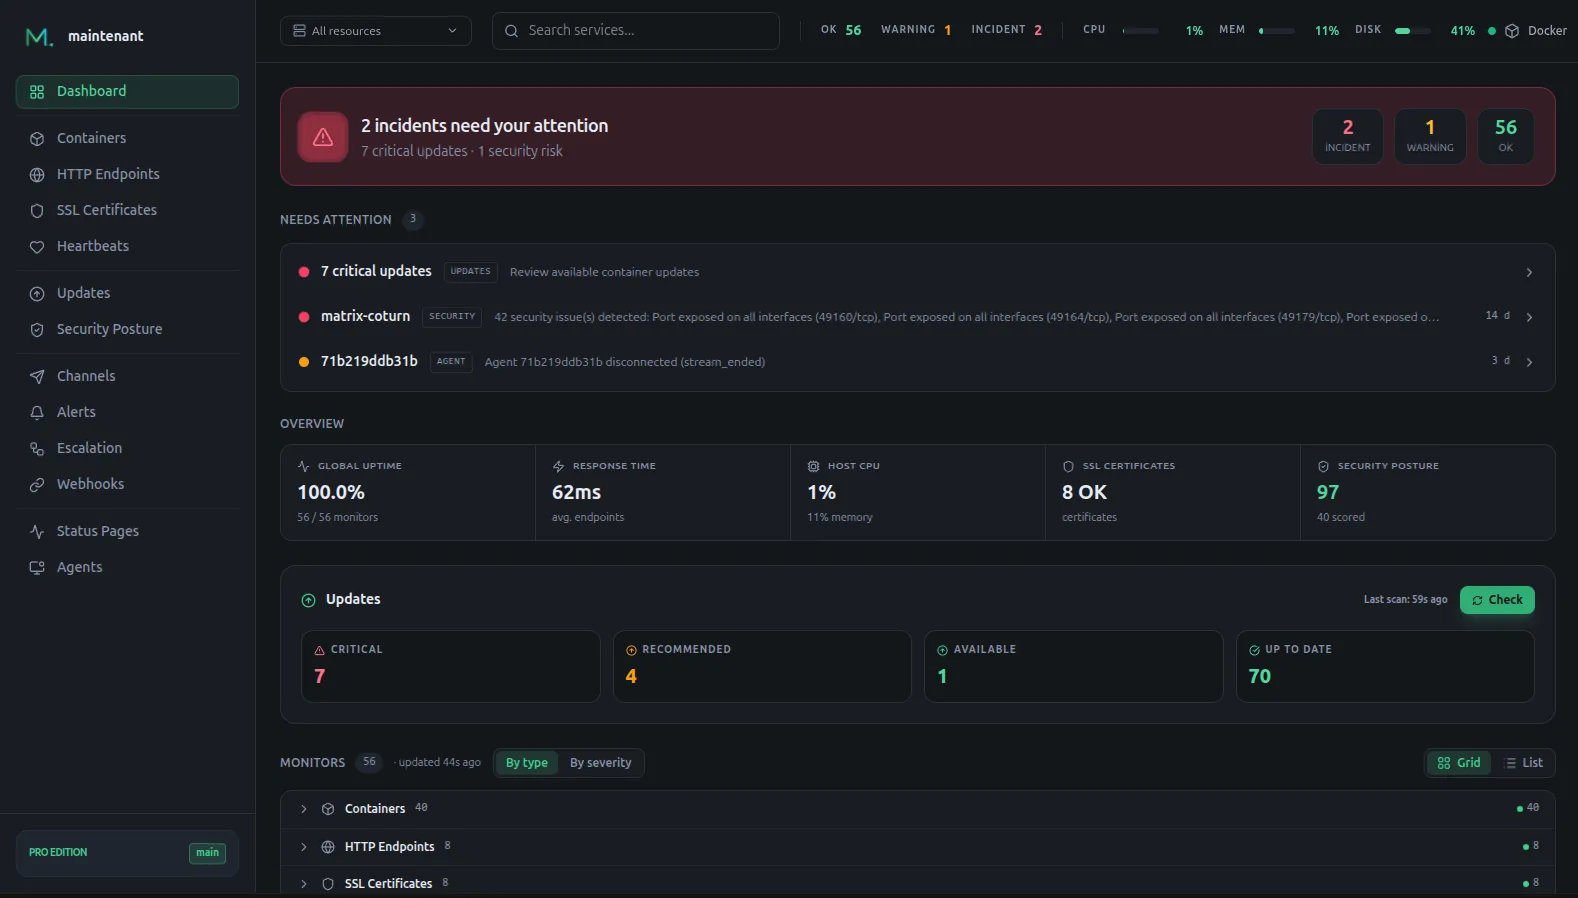
For the vast majority of self-hosters and small teams deploying with Docker Compose on 1-3 VPS instances, Maintenant covers 95% of monitoring needs:
- Are my containers running?
- Are my endpoints responding?
- Are my cron jobs executing?
- Are my SSL certificates valid?
- Is my disk filling up?
- Are there updates available?
One container. Zero configuration. No PromQL to learn.
Install Maintenant –> · Compare editions →