You run a homelab. Maybe it is a Raspberry Pi, an old laptop, or a mini PC under your desk. You have Nextcloud, Vaultwarden, maybe Jellyfin, a reverse proxy, and a handful of other services — all in Docker Compose.
You want to know when something breaks. But you also do not want your monitoring tool to consume half your RAM.
What Homelab Monitoring Needs to Be
Homelab hardware is limited. Your monitoring tool must be:
- Lightweight — under 50 MB RAM, ideally under 20 MB
- Self-contained — no external database, no SaaS dependency
- Zero config — you do not want to spend your weekend writing YAML
- Docker-aware — it should know about your containers, not just HTTP URLs
- Low maintenance —
docker compose pull && up -dand done
The Usual Suspects (And Why They Fall Short)
Prometheus + Grafana
The “enterprise” choice. Requires 3-5 containers and 400-800 MB of RAM. On a 4 GB Raspberry Pi running 15 services, that is a non-starter.
Netdata
Beautiful dashboards, per-second metrics — and 300+ MB of RAM. Plus it phones home by default. Your homelab monitoring tool should not have telemetry.
Uptime Kuma
Lightweight and simple, but it only monitors HTTP endpoints. It does not know about your containers, their resource usage, or their health checks. When your Nextcloud goes down because PostgreSQL crashed, Uptime Kuma tells you Nextcloud is unreachable — but not why.
Beszel
Lightweight and container-aware, but requires a hub/agent setup and misses HTTP endpoint monitoring, SSL tracking, and cron monitoring.
The Homelab-Friendly Setup
Maintenant was built for exactly this use case. One container, <30 MB RAM, zero config:
services:
  maintenant:
    image: ghcr.io/kolapsis/maintenant:latest
    ports:
      - "8080:8080"
    volumes:
      - /var/run/docker.sock:/var/run/docker.sock:ro
      - /proc:/host/proc:ro
      - maintenant-data:/data
    environment:
      MAINTENANT_ADDR: "0.0.0.0:8080"
      MAINTENANT_DB: "/data/maintenant.db"
    restart: unless-stopped

volumes:
  maintenant-data:
Deploy it. Open the dashboard. All your containers are already there.
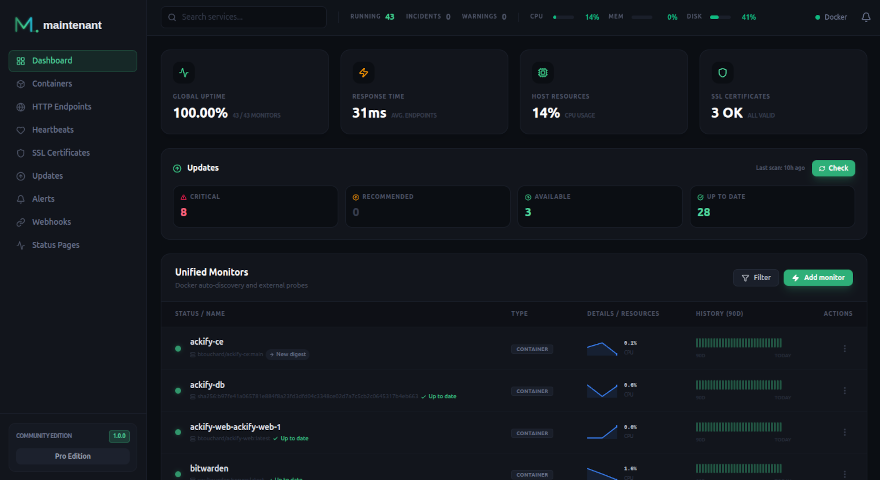
What You Get for 17 MB of RAM
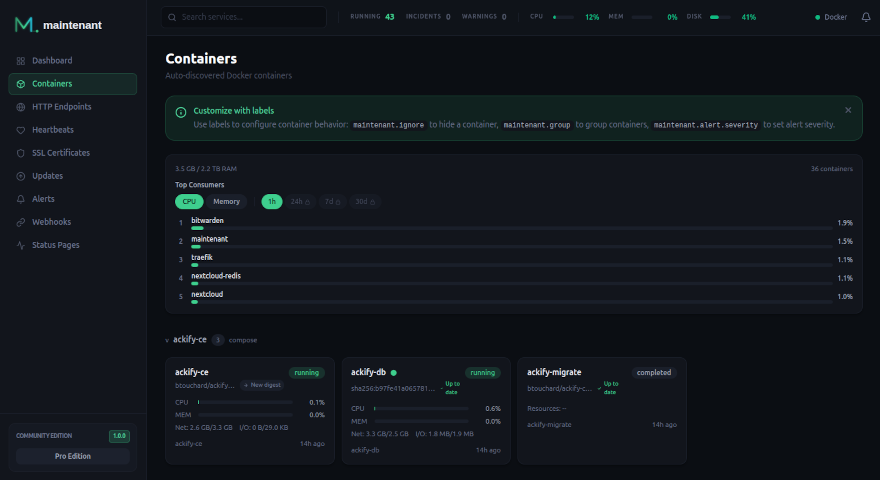
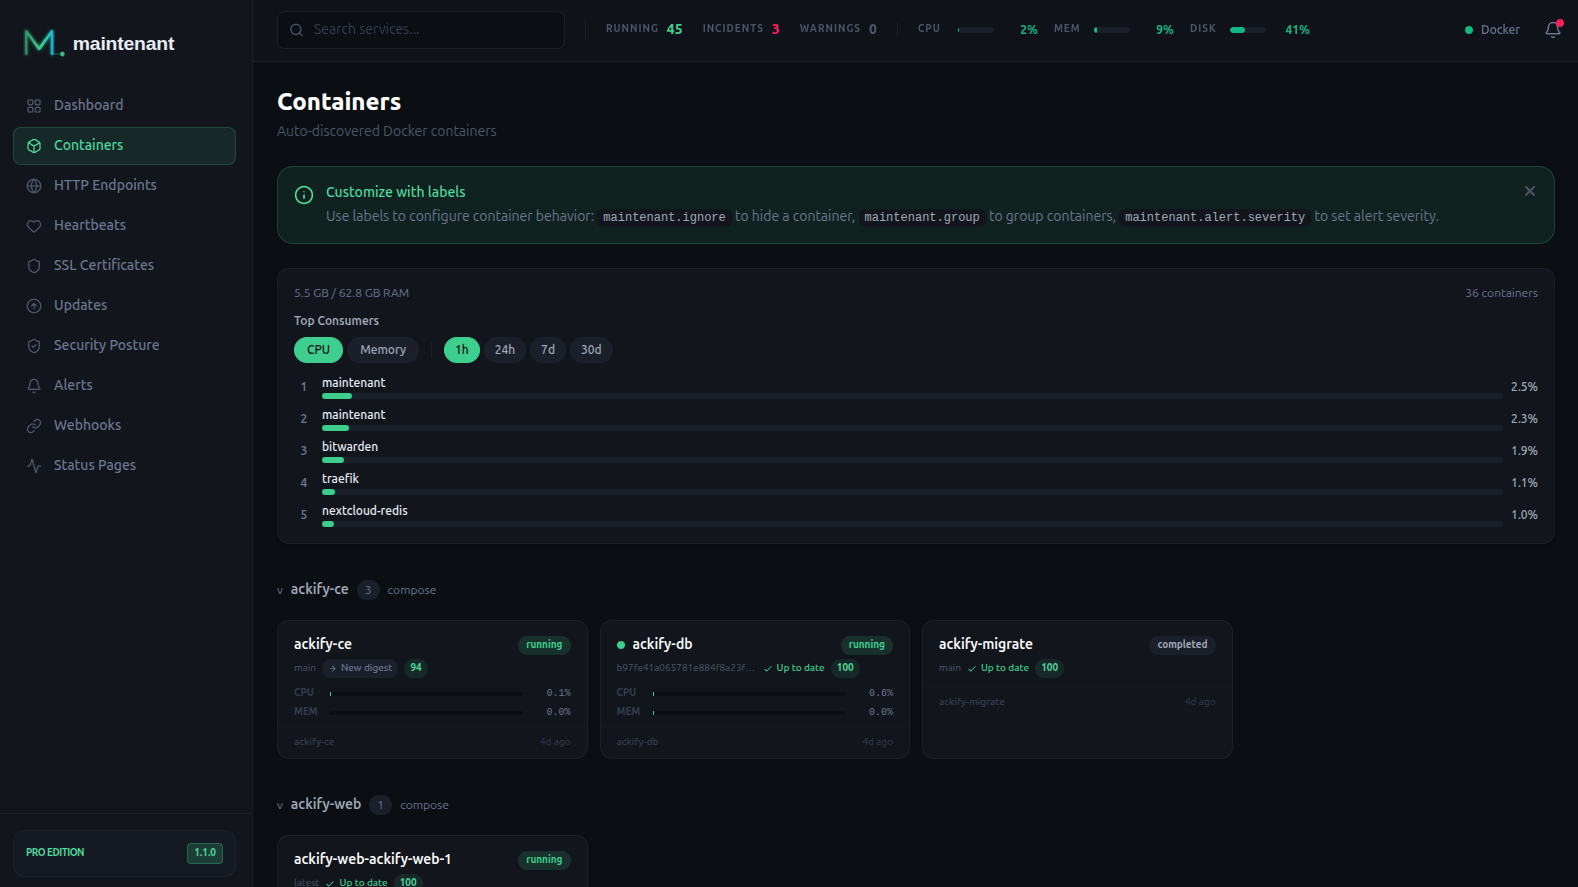
Container monitoring
Every container in your homelab, with state, uptime, health checks, restart detection, and Compose project grouping.
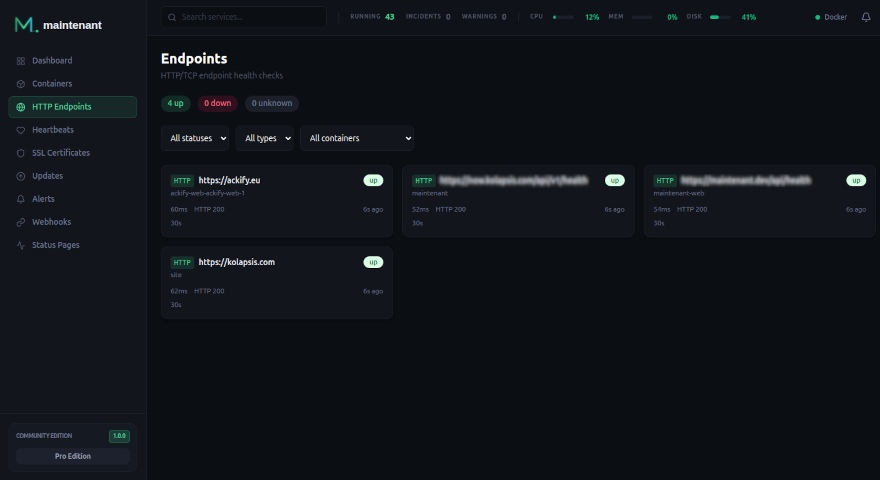
Endpoint monitoring
Add Docker labels to check that your services actually respond:
services:
  nextcloud:
    image: nextcloud:latest
    labels:
      maintenant.endpoint.http: "http://nextcloud:80"
      maintenant.endpoint.interval: "60s"

  vaultwarden:
    image: vaultwarden/server:latest
    labels:
      maintenant.endpoint.http: "http://vaultwarden:80/alive"
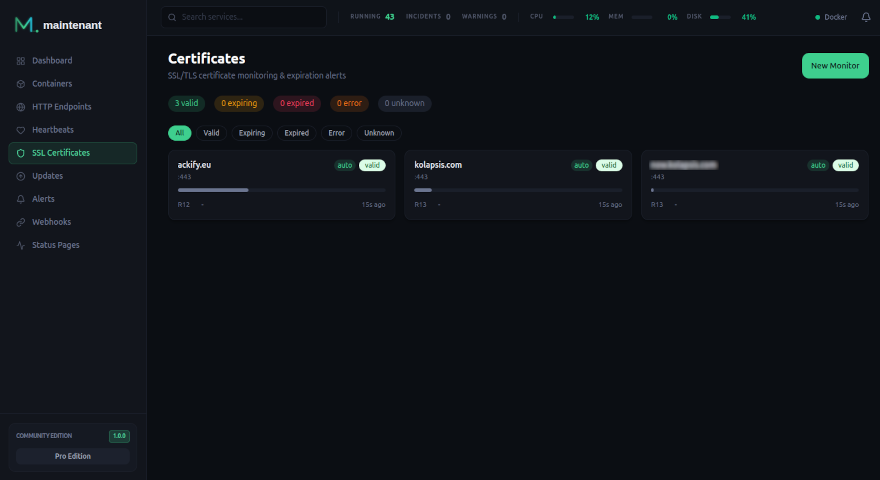
SSL certificate tracking
If you use Traefik or Caddy with Let’s Encrypt, Maintenant auto-detects your certificates and alerts you before they expire.
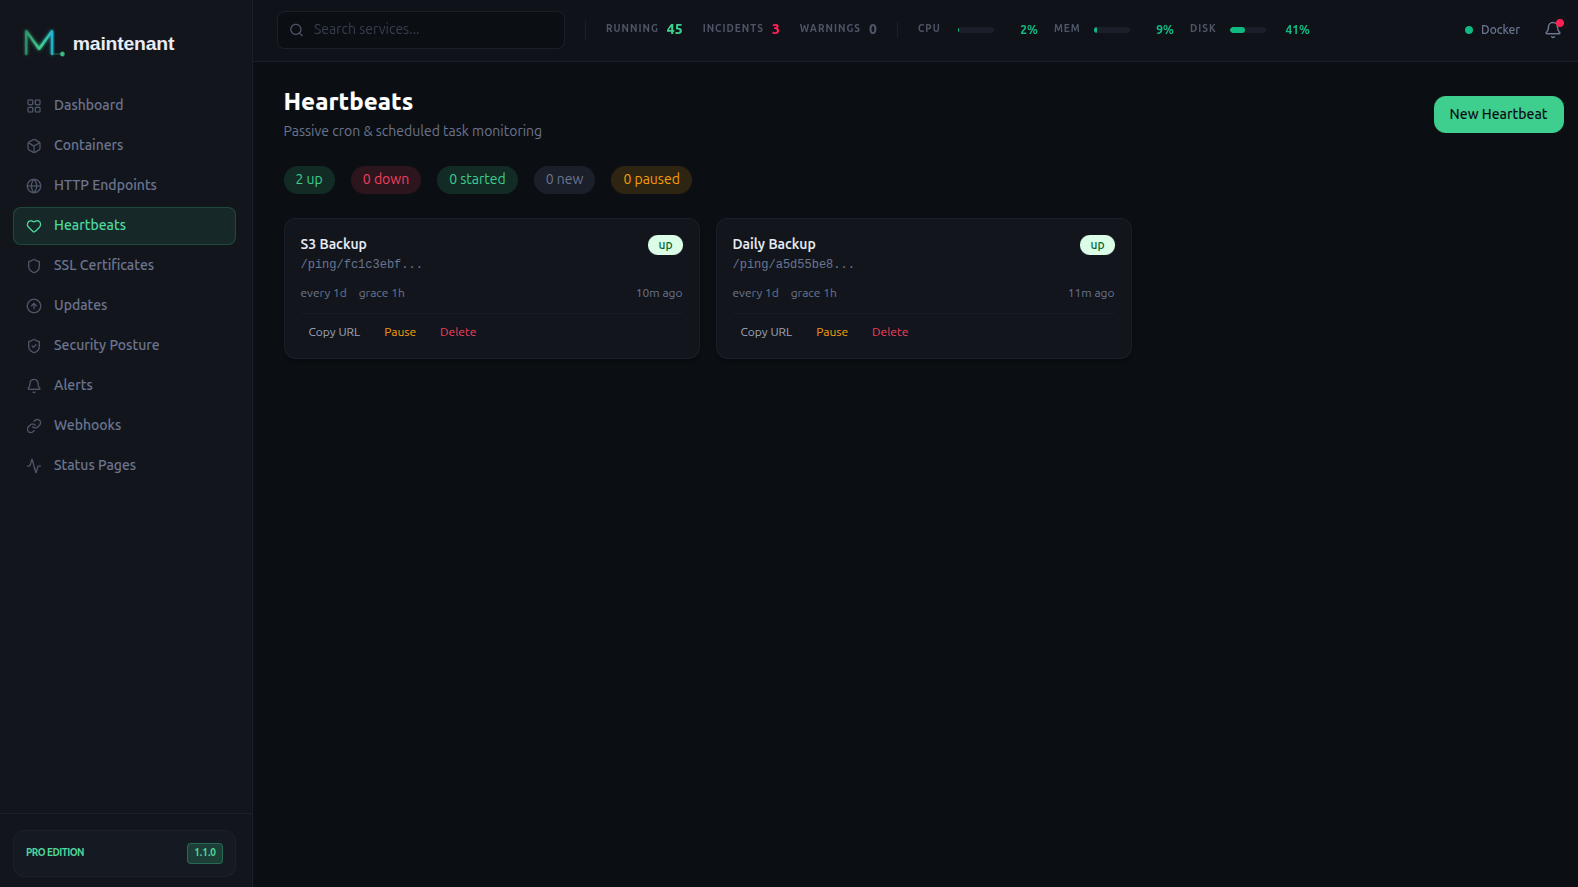
Backup monitoring
Your nightly backup script pings Maintenant when it finishes:
0 3 * * * /usr/local/bin/backup.sh && curl -fsS http://maintenant:8080/api/v1/ping/YOUR-UUID/$?
If the ping does not arrive, you get alerted. No more “I thought the backup was running” moments.
Resource monitoring
See which container is eating all your RAM or filling your disk — critical on limited homelab hardware.
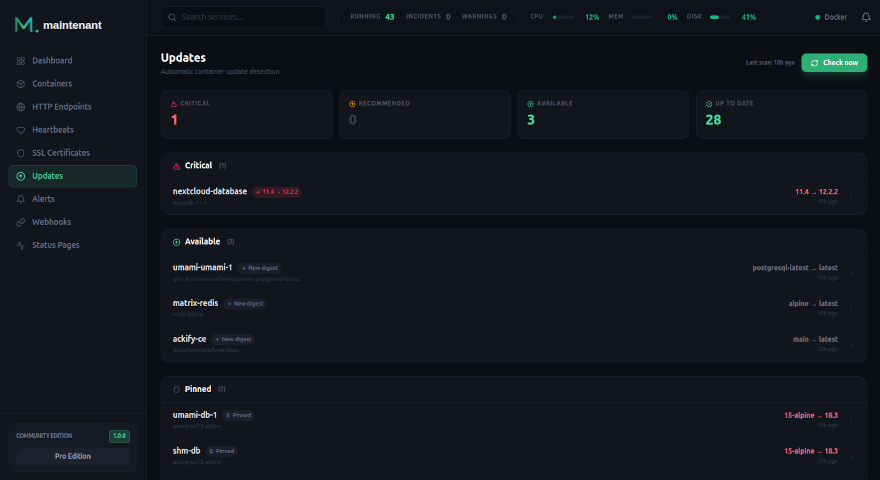
Update detection
Know when your images have updates available — especially security patches.
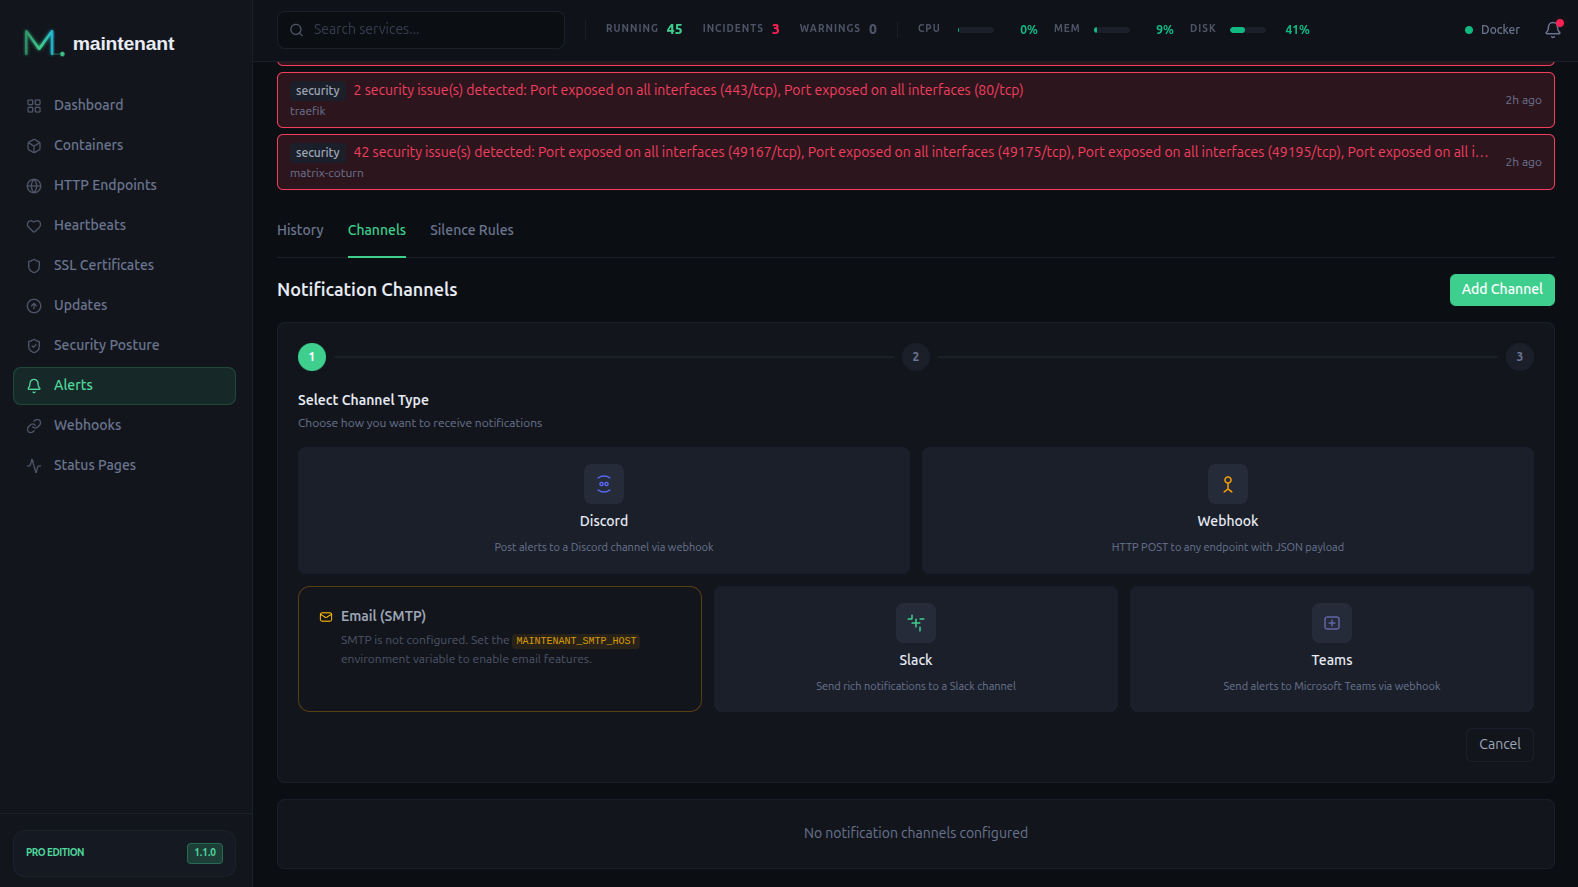
Alerts
Get notified on Discord or via webhook when something goes wrong. Pro adds Slack, Teams, and Email.
ARM Support
Maintenant runs on linux/amd64 and linux/arm64. If your homelab is a Raspberry Pi 4 or 5, it works out of the box.
The Resource Comparison
| Tool | RAM (idle) | Config files | Docker-aware |
|---|---|---|---|
| Prometheus + Grafana + cAdvisor | 400-800 MB | 3+ | Via cAdvisor |
| Netdata | 300-500 MB | 0 | Yes |
| Uptime Kuma | 100+ MB | 0 | No |
| Beszel | 50-100 MB | Agent config | Yes |
| Maintenant | <30 MB | 0 | Yes |
For a homelab, every megabyte counts. 17 MB is less than most of the services you are monitoring.