Prometheus is the default answer to “how do I monitor my Docker containers?” But for most Docker Compose setups, it is like using a telescope to look across the street.
This guide shows you how to monitor your entire Docker stack — containers, endpoints, certificates, cron jobs, resources — without touching Prometheus.
Why Not Prometheus?
Prometheus is designed for large-scale, distributed infrastructure. To monitor Docker containers, you need:
- Prometheus itself — scrapes metrics endpoints
- cAdvisor — exposes container metrics as Prometheus targets
- node_exporter — exposes host metrics
- Grafana — because Prometheus has no built-in dashboard
- Alertmanager — because Prometheus alerts need a separate routing engine
That is 5 containers, 3+ config files, and a query language (PromQL) to learn — just to answer “are my containers running?”
For a stack of 10-50 containers on a VPS, there are simpler approaches.
The Docker API Approach
Docker already knows everything about your containers. The Docker Engine API exposes:
- Container states (running, stopped, restarting, exited)
- Health check results
- CPU, memory, network, and disk I/O per container
- Real-time events (start, stop, die, health_status)
- Labels, Compose project grouping, exposed ports
A monitoring tool that connects directly to the Docker API can get all this data without any intermediate exporter. No cAdvisor. No scraping pipeline. No Prometheus.
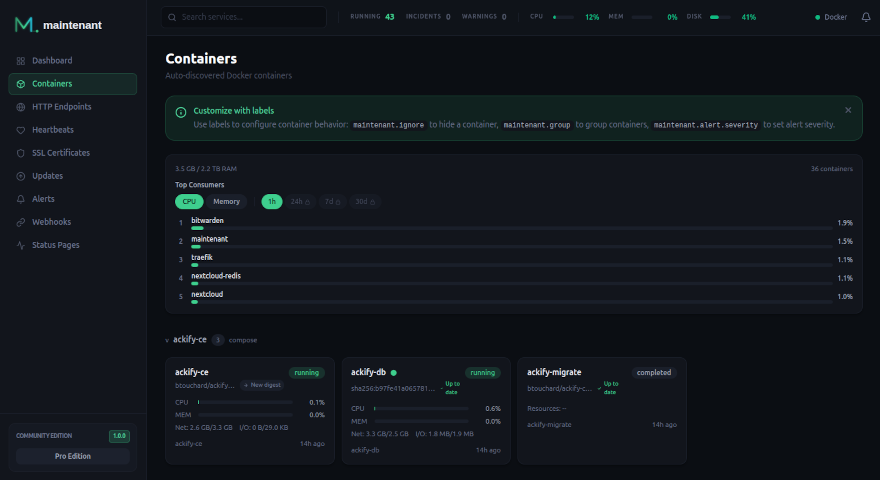
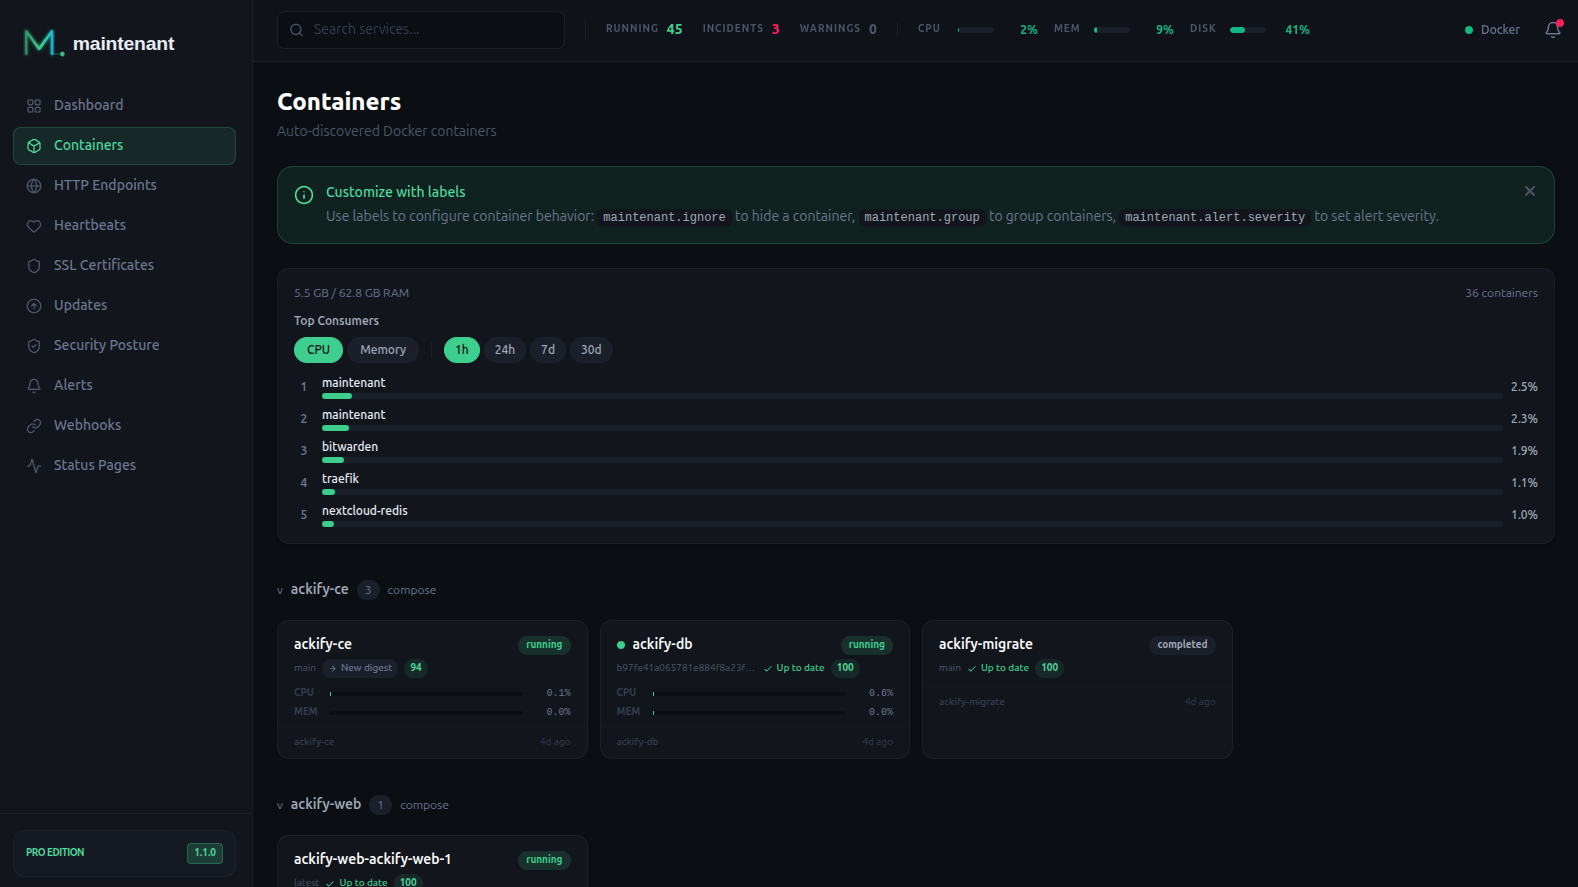
What You Actually Need to Monitor
For a typical Docker Compose stack, there are 6 things that matter:
1. Container states
Are my containers running? Are any in a restart loop? Did any exit with a non-zero code?
This is what Prometheus + cAdvisor gives you — but the Docker API gives you the same data directly.
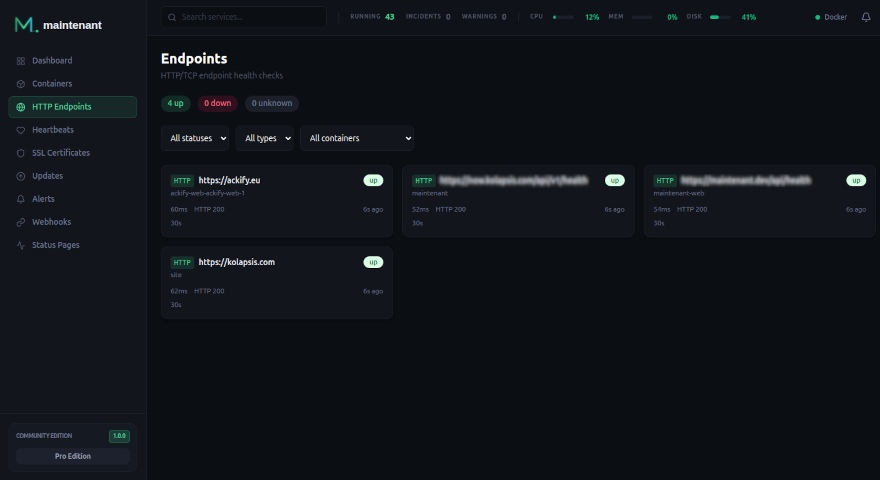
2. HTTP/TCP endpoints
Is my API responding? What is the latency? Is it returning the expected status code?
Prometheus needs the Blackbox Exporter for this. With Maintenant, you add Docker labels:
labels:
  maintenant.endpoint.http: "https://api.example.com/health"
  maintenant.endpoint.interval: "30s"
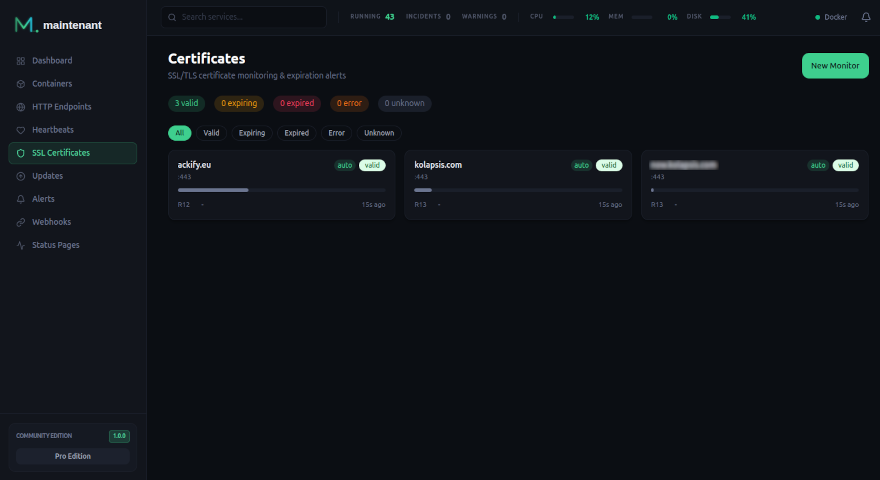
3. SSL certificates
Are my certificates valid? When do they expire? Is the chain complete?
Prometheus needs a dedicated SSL exporter. Maintenant auto-detects certificates on all HTTPS endpoints.
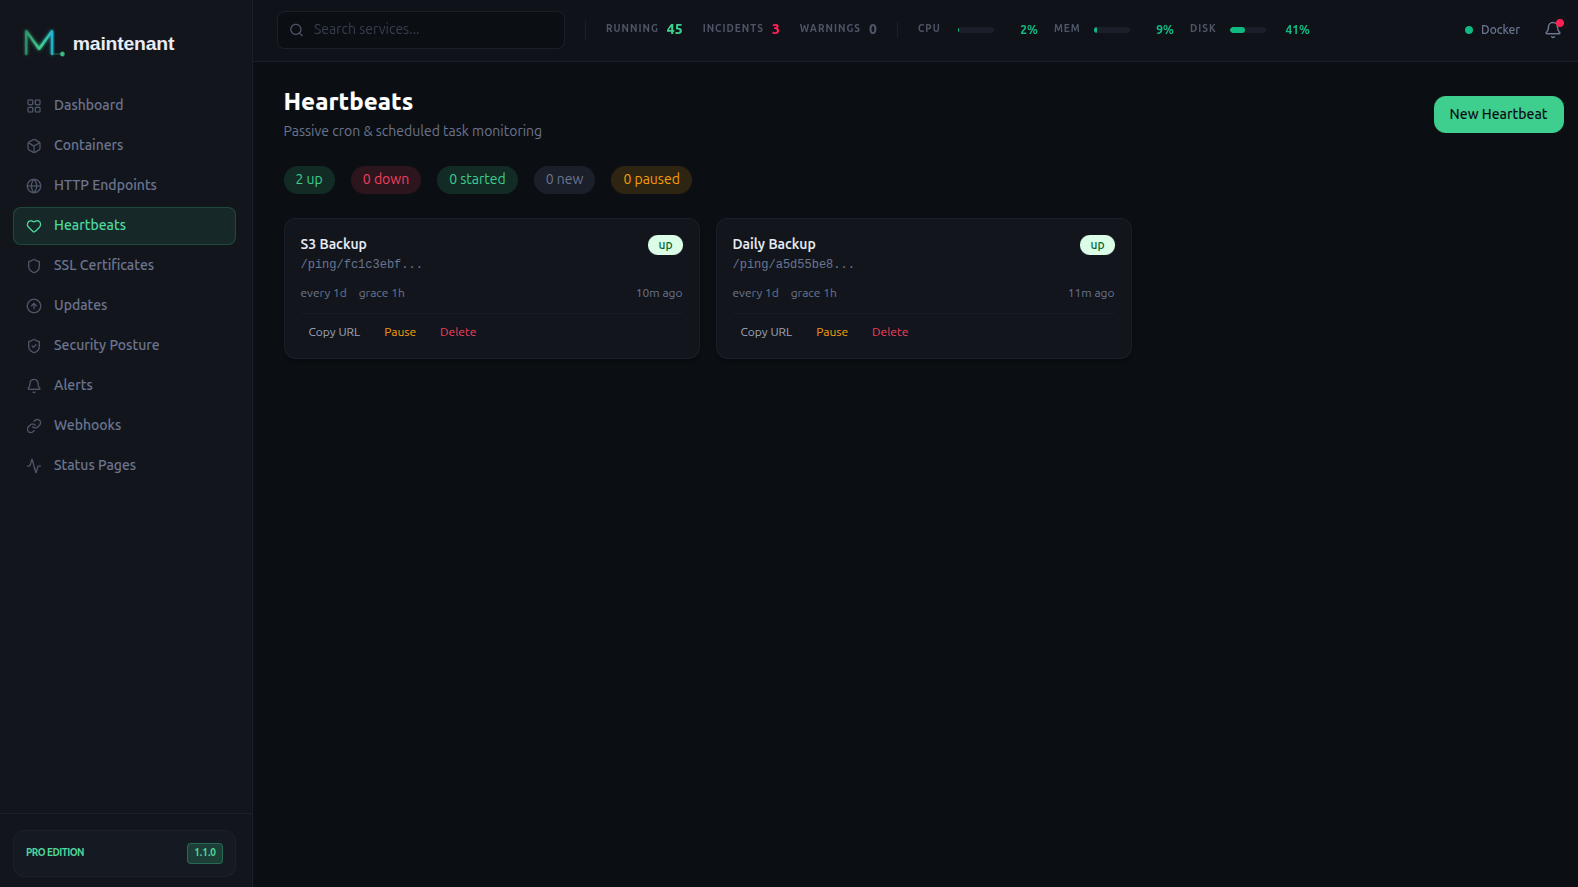
4. Cron jobs and scheduled tasks
Did my backup run last night? Did it succeed?
Prometheus has no built-in solution for this. Maintenant includes a heartbeat system with start/end signals.
5. System resources
CPU, RAM, disk, network — per container and per host.
This is where Prometheus shines with per-second granularity. But for “is my disk filling up?” and “which container is eating all the RAM?”, you do not need per-second resolution.
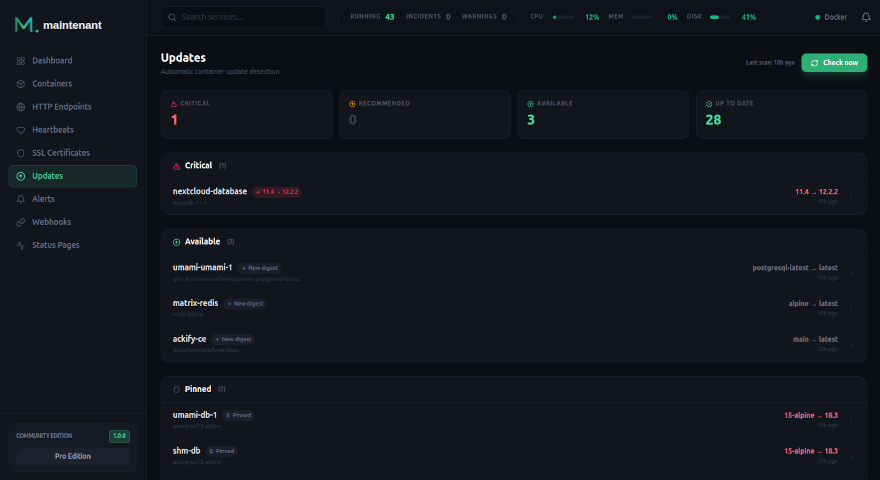
6. Update detection
Are there newer versions of my Docker images available? Are any of them security patches?
Prometheus does not do this at all. Maintenant scans OCI registries and compares digests.
The Practical Setup
One container. No config files. No PromQL.
services:
  # Your existing services...
  api:
    image: myapp:latest
    labels:
      maintenant.endpoint.http: "http://api:3000/health"

  postgres:
    image: postgres:16
    labels:
      maintenant.endpoint.tcp: "postgres:5432"

  # Add Maintenant
  maintenant:
    image: ghcr.io/kolapsis/maintenant:latest
    ports:
      - "8080:8080"
    volumes:
      - /var/run/docker.sock:/var/run/docker.sock:ro
      - /proc:/host/proc:ro
      - maintenant-data:/data
    environment:
      MAINTENANT_ADDR: "0.0.0.0:8080"
      MAINTENANT_DB: "/data/maintenant.db"
    restart: unless-stopped

volumes:
  maintenant-data:
docker compose up -d
Open http://your-server:8080. All your containers are already there. Endpoints are monitored. SSL certificates are tracked. Resources are graphed.
No prometheus.yml. No Grafana datasource. No PromQL to learn.
When You DO Need Prometheus
Keep Prometheus if you need:
- Per-second metric granularity for performance debugging
- Custom application metrics (Go/Java/Python instrumented code)
- PromQL for ad-hoc data exploration
- Multi-cluster federation
- Long-term metric storage (years)
For everything else — and that covers 95% of self-hosted Docker stacks — you can skip Prometheus entirely.
Read the full comparison: Maintenant vs Prometheus + Grafana →