Every monitoring tool asks you to write config files. Prometheus needs prometheus.yml. Grafana needs datasource configs. Alertmanager needs routing rules. Even Uptime Kuma needs you to click through a web UI to add each monitor manually.
What if your monitoring tool just… figured it out?
The Config File Problem
Config files create three problems:
- Drift — your monitoring config drifts from your actual infrastructure. You add a new service and forget to add a monitor. You rename a container and the old alert keeps firing.
- Duplication — your service is defined in
docker-compose.yml, then again inprometheus.yml, then again in Grafana. Three places to update for every change. - Learning curve — every tool has its own config format. PromQL, YAML with specific schemas, JSON datasources. Each one is another thing to learn.
The Label-Based Approach
Docker labels are metadata attached to your containers. They are defined in your docker-compose.yml — the same file where your services live. No separate config files.
Maintenant reads Docker labels to configure monitoring:
services:
  api:
    image: myapp:latest
    labels:
      maintenant.endpoint.http: "http://api:3000/health"
      maintenant.endpoint.interval: "30s"
      maintenant.endpoint.http.expected-status: "200"

  postgres:
    image: postgres:16
    labels:
      maintenant.endpoint.tcp: "postgres:5432"

  redis:
    image: redis:7-alpine
    labels:
      maintenant.endpoint.tcp: "redis:6379"
Your monitoring configuration lives alongside your service definition. When you add a new service, the monitoring is right there. When you remove a service, the monitoring goes with it. No drift.
What Gets Auto-Discovered (Zero Config)
Even without any labels, Maintenant auto-discovers:
- All containers — states, health checks, restart loops, exit codes
- Compose projects — containers grouped by their
com.docker.compose.projectlabel - SSL certificates — auto-detected on all HTTPS endpoints you monitor
- System resources — CPU, RAM, network, disk per container and per host
- Available updates — OCI digest comparison for all running images
What You Configure via Labels
Labels add monitoring that requires knowing what to check:
HTTP endpoint checks
labels:
  maintenant.endpoint.http: "https://api.example.com/health"
  maintenant.endpoint.interval: "15s"
  maintenant.endpoint.http.expected-status: "200"
TCP connectivity checks
labels:
  maintenant.endpoint.tcp: "postgres:5432"
Alert severity
labels:
  maintenant.alert.severity: "critical"
A Complete Example
Here is a full Docker Compose stack with monitoring built in — zero external config files:
services:
  traefik:
    image: traefik:v3
    ports:
      - "80:80"
      - "443:443"
    volumes:
      - /var/run/docker.sock:/var/run/docker.sock:ro

  api:
    image: myapp:latest
    labels:
      maintenant.endpoint.http: "http://api:3000/health"
      maintenant.endpoint.interval: "15s"

  worker:
    image: myapp:latest
    command: worker

  postgres:
    image: postgres:16
    labels:
      maintenant.endpoint.tcp: "postgres:5432"
    volumes:
      - pgdata:/var/lib/postgresql/data

  redis:
    image: redis:7-alpine
    labels:
      maintenant.endpoint.tcp: "redis:6379"

  maintenant:
    image: ghcr.io/kolapsis/maintenant:latest
    ports:
      - "8080:8080"
    volumes:
      - /var/run/docker.sock:/var/run/docker.sock:ro
      - /proc:/host/proc:ro
      - maintenant-data:/data
    environment:
      MAINTENANT_ADDR: "0.0.0.0:8080"
      MAINTENANT_DB: "/data/maintenant.db"
    restart: unless-stopped

volumes:
  pgdata:
  maintenant-data:
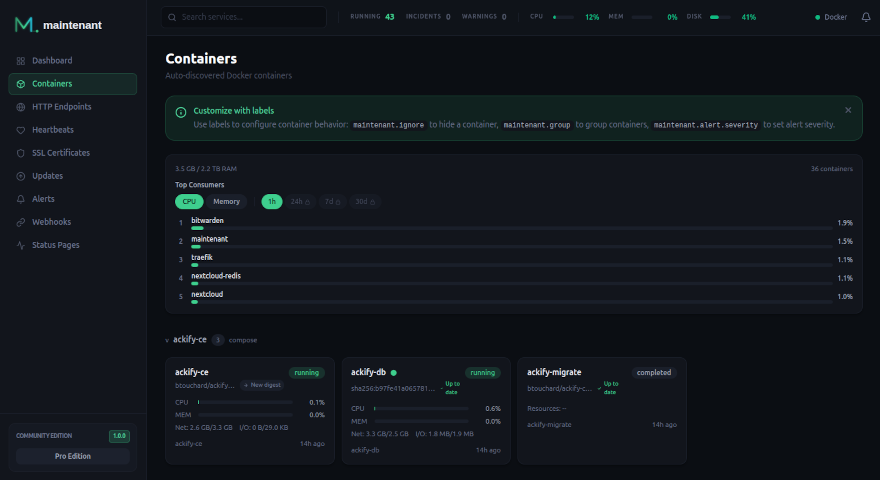
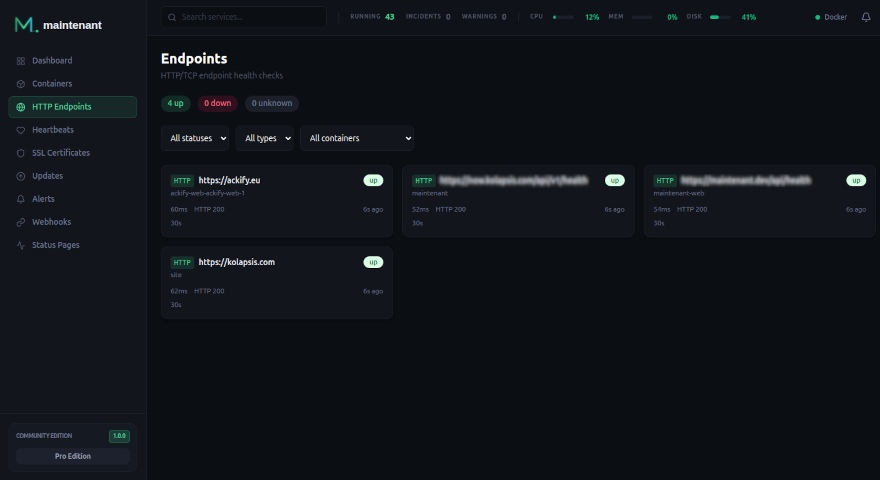
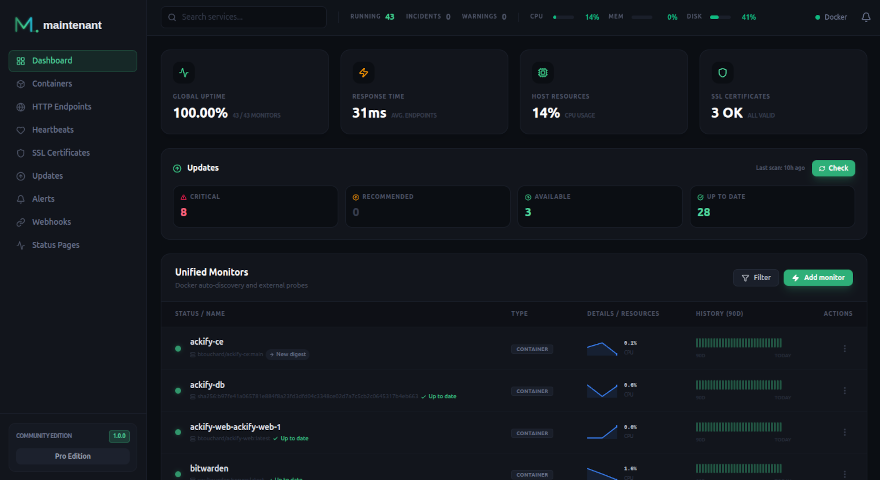
docker compose up -d
That is it. Six services monitored. Zero config files written. The dashboard shows everything:
Compared to the Config File Approach
| Prometheus + Grafana | Maintenant | |
|---|---|---|
| Service definition | docker-compose.yml | docker-compose.yml |
| Monitoring config | prometheus.yml + scrape configs | Docker labels (same file) |
| Dashboard config | Grafana JSON + datasources | Auto-generated |
| Alert config | alertmanager.yml + rules files | Built-in defaults + labels |
| Config files total | 3-5 | 0 |
| Config locations | 3-5 separate files | 1 file (docker-compose.yml) |
Why This Matters
Monitoring-as-code should not mean “more code files to maintain.” It should mean “monitoring that lives where your services live.”
Docker labels achieve this. Your monitoring configuration is:
- Versioned — it is in your
docker-compose.yml, which is in your git repo - Colocated — next to the service it monitors, not in a separate directory
- Atomic — when you remove a service, its monitoring goes with it
- Discoverable — anyone reading the compose file sees what is monitored
No prometheus.yml. No grafana.ini. No alertmanager.yml. Just your docker-compose.yml with a few extra labels.