The Complexity Problem
Prometheus + Grafana is the gold standard monitoring stack. It powers some of the largest infrastructures in the world. But for a typical Docker Compose stack of 10-50 containers on a VPS, it is massively overkill.
To monitor your containers with the Grafana stack, you need at minimum:
- Prometheus — metrics collection and storage
- cAdvisor — exposes container metrics to Prometheus
- Grafana — visualization and dashboards
- node_exporter — host system metrics (recommended)
- Alertmanager — alert routing (if you want notifications)
That is 3 to 5 extra containers just to monitor the containers you already have. Each one with its own configuration, its own updates, its own failure modes. The irony: your monitoring stack can go down independently of your applications.
And then there is PromQL. Writing an alert rule for “my Redis container uses more than 80% of its allocated memory” requires:
container_memory_usage_bytes{name="redis"} /
container_spec_memory_limit_bytes{name="redis"} > 0.8
With Maintenant, you add a Docker label and the default thresholds handle the rest.
Who Should NOT Switch
Maintenant does not replace Prometheus + Grafana if you need:
- Ad-hoc queries — PromQL lets you freely explore and correlate any metric. Maintenant has pre-built views with no custom query language.
- Custom dashboards — Grafana’s dashboard builder is unmatched. Maintenant’s views are opinionated and fixed.
- Long-term metric retention — Prometheus can store years of high-resolution data. Maintenant retains 7 days (Community) or 1 year (Pro).
- Multi-cluster federation — Prometheus federation allows aggregating metrics across clusters. Maintenant is per-host or per-cluster.
- Application-level metrics — if your Go/Java/Python app exposes custom Prometheus metrics, Maintenant does not scrape them.
If you have a dedicated SRE team and hundreds of microservices, stick with Prometheus + Grafana.
Who Should Switch
- Self-hosters who spent more time configuring Prometheus than running their actual services
- Small teams who need “is everything running?” not “what is the 95th percentile of request duration across my service mesh?”
- Developers who want monitoring without learning PromQL, writing Grafana dashboards, or maintaining a 5-container monitoring stack
- Homelab enthusiasts tired of cAdvisor eating 200+ MB of RAM just to expose container metrics
Maintenant vs Prometheus + Grafana — Feature Comparison
| Capability | Prometheus + Grafana | Maintenant |
|---|---|---|
| Container monitoring | ✓ (via cAdvisor) | ✓ (built-in) |
| Auto-discovery | ✗ (manual targets) | ✓ |
| HTTP/TCP endpoint checks | ✗ (needs Blackbox Exporter) | ✓ |
| SSL certificate monitoring | ✗ (needs separate exporter) | ✓ |
| Heartbeat / cron monitoring | ✗ | ✓ (10 free, unlimited Pro) |
| CPU / RAM / disk metrics | ✓ | ✓ |
| Update detection (OCI digest) | ✗ | ✓ |
| Public status page | ✗ | ✓ (Pro: incidents, maintenance) |
| Network security insights | ✗ | ✓ (Pro: CVE + risk score) |
| Alerts | ✓ (Alertmanager) | Webhook + Discord (free), Slack/Teams/Email (Pro) |
| Custom queries (PromQL) | ✓ | ✗ |
| Custom dashboards | ✓ | ✗ |
| Application-level metrics | ✓ | ✗ |
| Multi-cluster federation | ✓ | ✗ |
| Self-hosted | ✓ | ✓ |
| Containers required | 3-5 | 1 |
| Config files | prometheus.yml + per-exporter | 0 |
| Setup time | 1-2 hours | 30 seconds |
| RAM usage (idle) | 500+ MB (combined) | ~17 MB |
| Price | Free | Free (Community) / 9 €/month (Pro) |
The Numbers
| Prometheus + Grafana | Maintenant | |
|---|---|---|
| Containers to deploy | 3-5 (Prometheus, Grafana, cAdvisor, node_exporter, Alertmanager) | 1 |
| Config files to write | 3+ (prometheus.yml, alertmanager.yml, Grafana datasources) | 0 |
| Time to first dashboard | 1-2 hours | 30 seconds |
| RAM footprint (idle) | ~500 MB+ combined | ~17 MB |
| Learning curve | PromQL + Grafana dashboard builder | None |
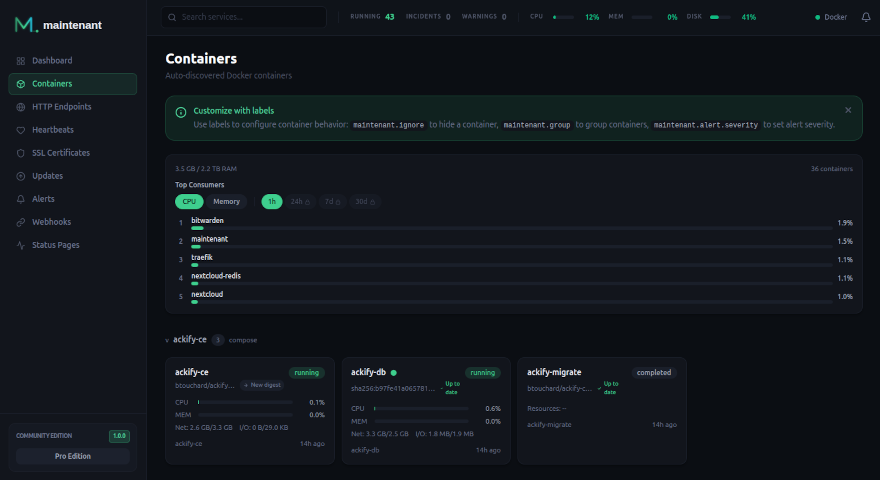
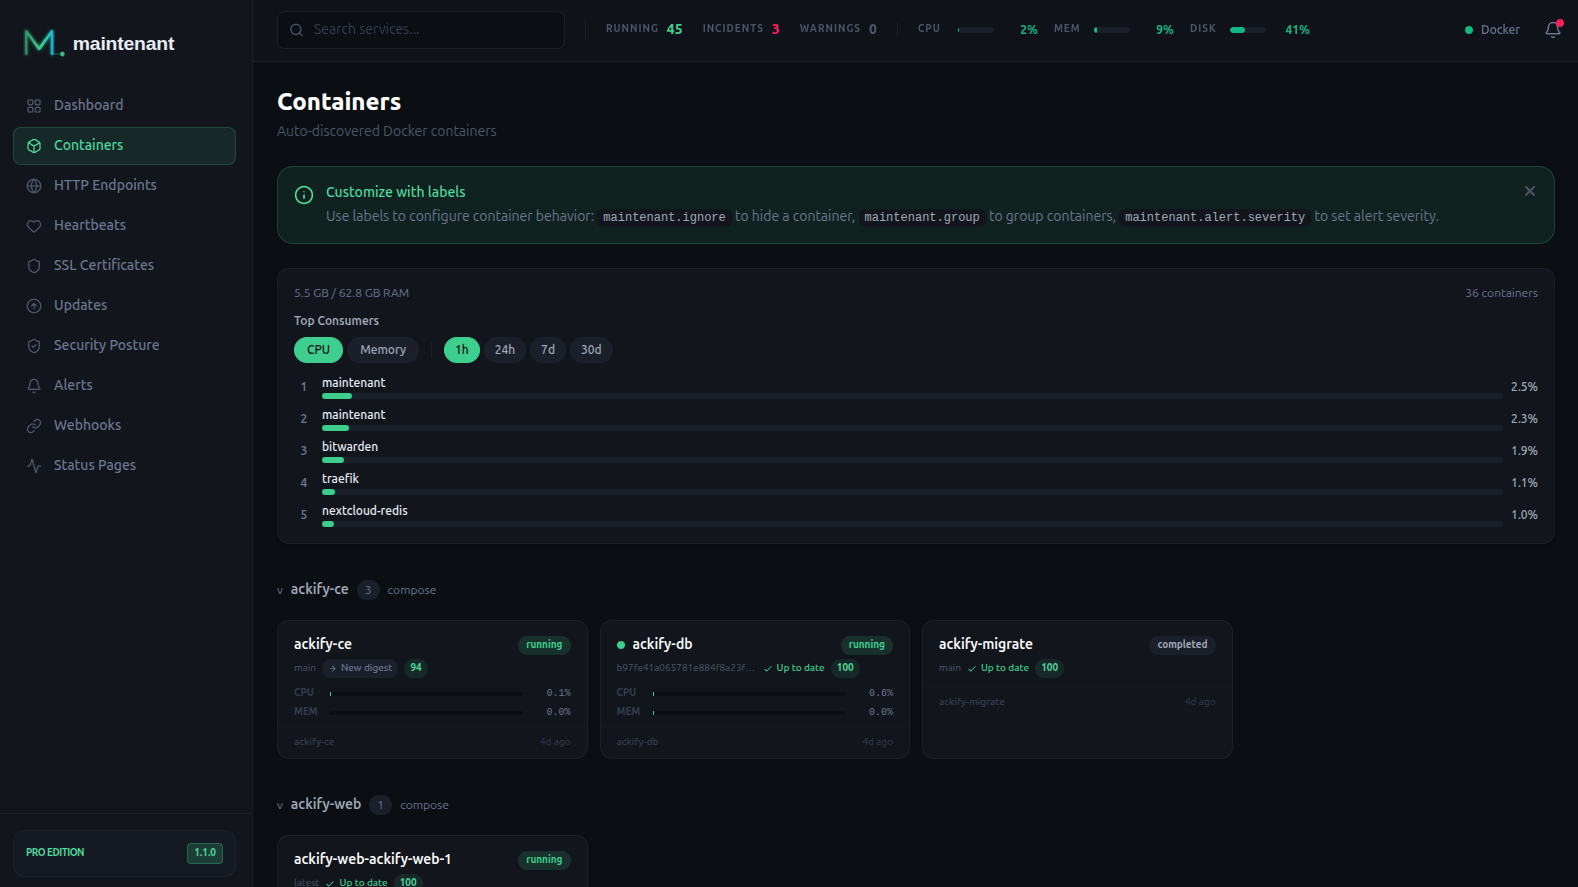
What You Get with Maintenant
One container. Zero config files. Everything monitored:
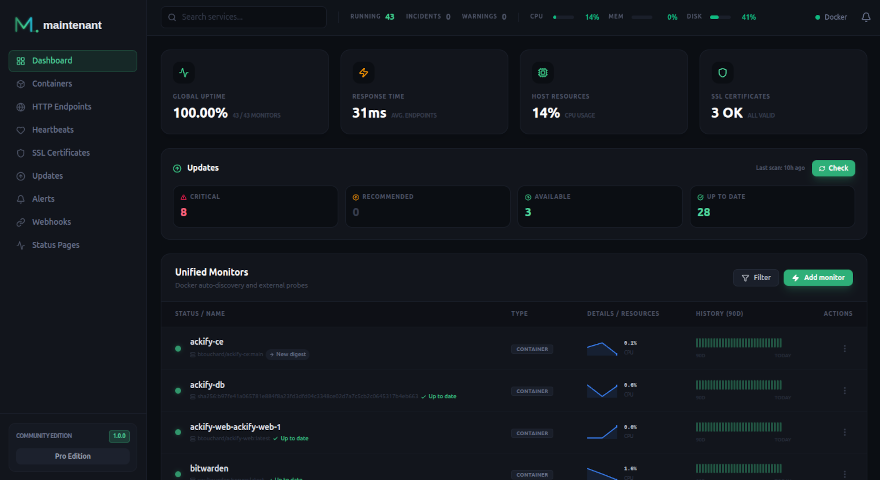
- Container auto-discovery — Docker and Kubernetes, no targets to declare
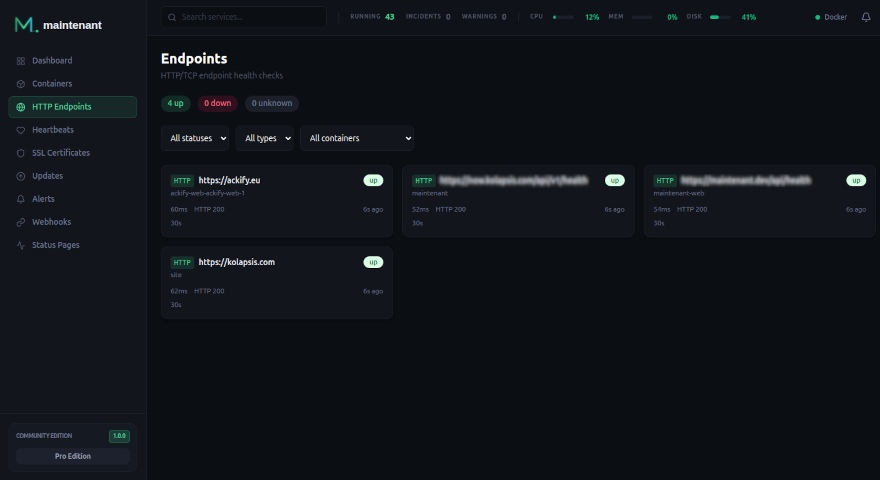
- HTTP/TCP endpoint monitoring — configured via Docker labels, no Blackbox Exporter needed
- SSL/TLS certificate tracking — automatic detection, no separate exporter
- Heartbeat / cron job monitoring — built-in, no external tool needed (10 free, unlimited with Pro)
- System resources — CPU, RAM, network, disk per container and per host
- Update intelligence — OCI digest scan across all containers
- Unified alerts — webhook, Discord (Community), Slack, Teams, Email (Pro)
- Public status page — real-time, SSE updates (Pro: incident management, maintenance windows)
Migrating from Prometheus + Grafana
No data migration needed. Deploy Maintenant alongside your existing stack, verify it covers your needs, then remove Prometheus, Grafana, cAdvisor, and the rest:
# docker-compose.yml — replace 5 containers with 1
services:
  maintenant:
    image: ghcr.io/kolapsis/maintenant:latest
    ports:
      - "8080:8080"
    volumes:
      - /var/run/docker.sock:/var/run/docker.sock:ro
      - /proc:/host/proc:ro
      - maintenant-data:/data
    environment:
      MAINTENANT_ADDR: "0.0.0.0:8080"
      MAINTENANT_DB: "/data/maintenant.db"
    restart: unless-stopped

volumes:
  maintenant-data:
docker compose up -d
Open http://your-server:8080 — your containers are already there. No prometheus.yml. No Grafana datasources. No PromQL.
FAQ
Can I run Maintenant alongside Prometheus during a transition? Yes. Maintenant is read-only and does not interfere with any other monitoring tool.
I have custom Prometheus metrics in my apps. Can Maintenant scrape them? No. Maintenant monitors the infrastructure layer (containers, endpoints, certificates, resources), not application-level metrics. If you need both, you can keep Prometheus for app metrics and use Maintenant for everything else.
What about Grafana Cloud or Prometheus-as-a-Service? If you are already paying for a managed Prometheus service, Maintenant offers a radically simpler (and cheaper) alternative for infrastructure monitoring. But it does not replace application observability.
Does Maintenant support Kubernetes? Yes. It auto-detects the runtime and uses read-only RBAC to discover workloads.