What Netdata Does Well
Netdata is a comprehensive real-time monitoring tool with an impressive feature set. It collects thousands of metrics per second, has beautiful auto-generated dashboards, and provides deep visibility into system performance. The per-second granularity is unmatched.
For deep system performance analysis and debugging, Netdata is incredibly powerful.
The Weight Problem
Netdata’s power comes at a cost:
- RAM usage scales with metric count: Netdata documents its footprint as roughly
unique_metrics × 16 KiBon top of ~32 MiB of caches. That is modest on a quiet host and grows quickly on a busy one — a container host collecting tens of thousands of series routinely sits in the hundreds of megabytes. On a 2 GB VPS running your actual services, monitoring becomes a line item you have to budget for. - CPU usage: Collecting thousands of metrics per second is not free. Netdata can consume 5-15% of a single CPU core continuously.
- Telemetry: Netdata collects anonymous usage statistics by default. While it can be disabled, many self-hosters are uncomfortable with a monitoring tool that phones home.
- Netdata Cloud: The product increasingly pushes users toward Netdata Cloud, their SaaS platform. Some features require a Cloud account.
For a self-hoster running a homelab or a small production stack, Netdata can consume more resources than some of the services it monitors.
Who Should NOT Switch
Maintenant does not replace Netdata if you need:
- Per-second metric granularity: Netdata collects metrics every second. Maintenant samples container metrics every 10 seconds.
- Deep system internals: Netdata monitors 2,000+ system metrics (kernel, networking stack, disk I/O queues, etc.). Maintenant monitors the essentials: CPU, RAM, disk, network.
- Application-level monitoring: Netdata has collectors for databases, web servers, message queues. Maintenant monitors the infrastructure layer.
- Machine learning anomaly detection: Netdata includes built-in ML for anomaly detection. Maintenant does not.
Who Should Switch
- Homelab users whose monitoring tool’s memory grows with the number of metrics it collects
- VPS users on limited resources (1-4 GB RAM) who want a monitoring tool that uses about 100 MB of RAM rather than one that scales with the number of series collected
- Privacy-conscious users who want no cloud account, and telemetry they can switch off with one variable
- Teams who need HTTP endpoint monitoring, SSL tracking, and cron monitoring, things Netdata does not do well
- Docker-first users who want container-aware monitoring with auto-discovery and Docker labels
Maintenant vs Netdata: Feature Comparison
| Capability | Netdata | Maintenant |
|---|---|---|
| CPU / RAM / disk / network metrics | ✓ (2,000+ metrics) | ✓ (essential metrics) |
| Container monitoring | ✓ | ✓ |
| Container auto-discovery | ✓ | ✓ |
| HTTP/TCP endpoint checks | Limited | ✓ (active probing) |
| SSL certificate monitoring | ✗ | ✓ |
| Heartbeat / cron monitoring | ✗ | ✓ (5 free, unlimited from Personal) |
| Update detection (OCI digest) | ✗ | ✓ |
| Public status page | ✗ | ✓ (Personal: incidents · Pro: maintenance) |
| Network security insights | ✗ | ✓ (Personal: CVE + risk score) |
| Alerts | Limited | Webhook + Discord (free), Email + Telegram (Personal), Slack/Teams (Pro) |
| Per-second granularity | ✓ | ✗ |
| ML anomaly detection | ✓ | ✗ |
| Application collectors | ✓ (200+) | ✗ |
| Self-hosted (no cloud required) | Partial (some features need Cloud) | ✓ (no cloud account) |
| Telemetry | On by default | Anonymous counts, opt-out |
| Config via Docker labels | ✗ | ✓ |
| Kubernetes native | ✓ | ✓ |
| RAM | Scales with metric count (~32 MiB caches + 16 KiB/series) | about 100 MB after several days on a busy host |
| Price | Free (OSS) / paid Cloud | Free (Community) / 149 € incl. VAT once (Personal) / 29 € excl. VAT/month (Pro) |
The Numbers
| Netdata | Maintenant | |
|---|---|---|
| RAM | Scales with metric count | about 100 MB after several days on a busy host |
| CPU usage (continuous) | 5-15% of 1 core | < 1% |
| Disk usage (1 week) | 1-5 GB | ~50-100 MB |
| Telemetry | Anonymous stats (opt-out) | Anonymous counts (opt-out) |
| Cloud account needed | For some features | Never |
What You Get with Maintenant
Focused monitoring that covers what matters, at a fraction of the resource cost:
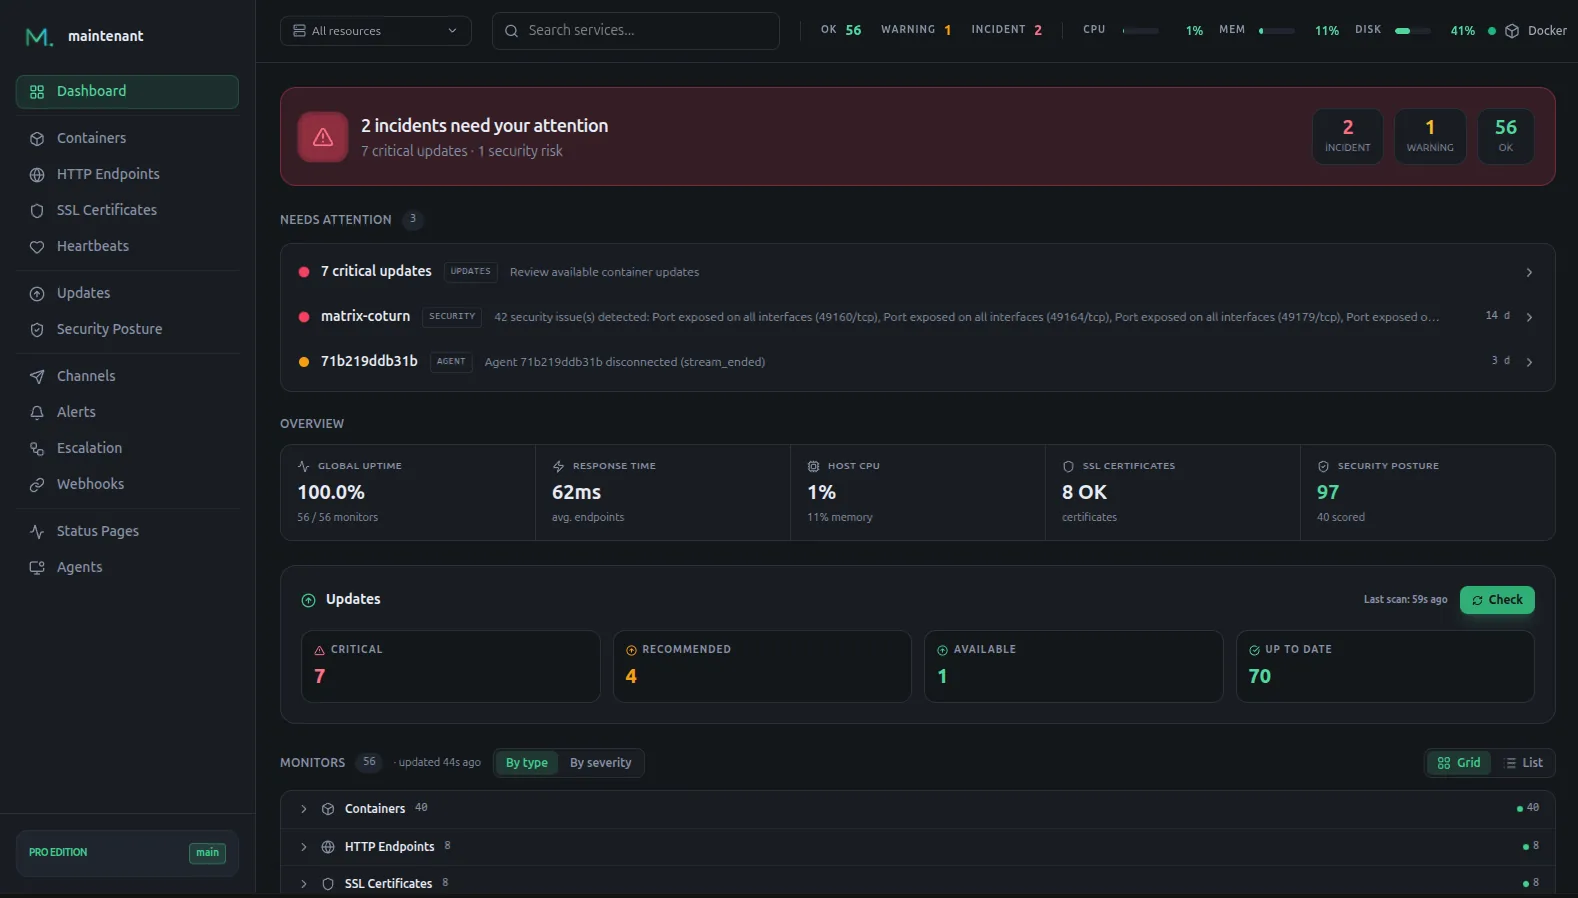
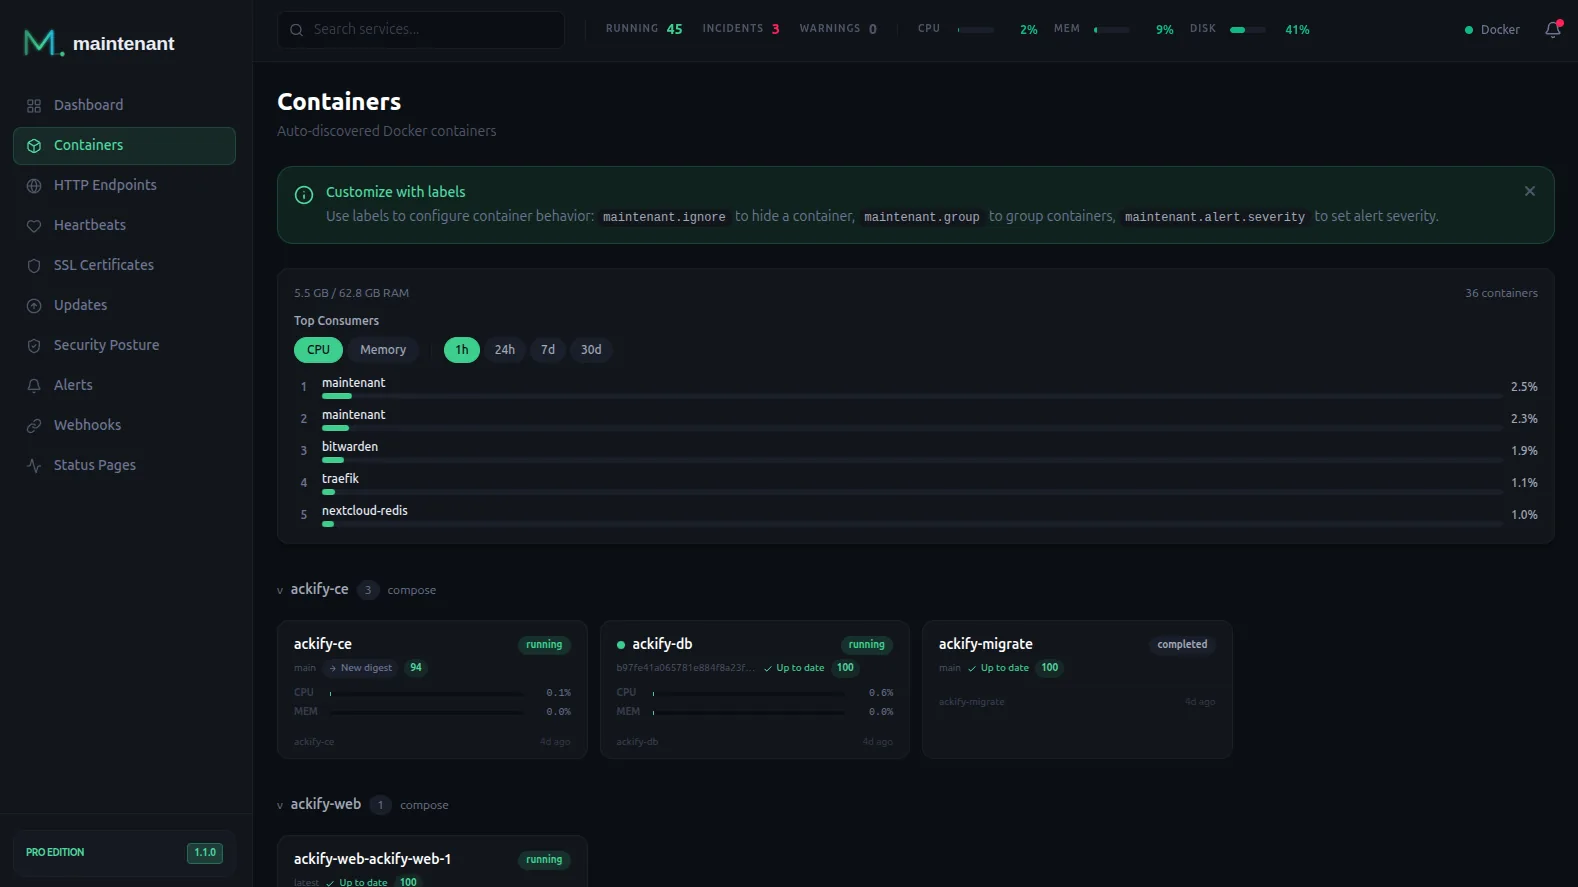
- Container auto-discovery: Docker and Kubernetes, zero config
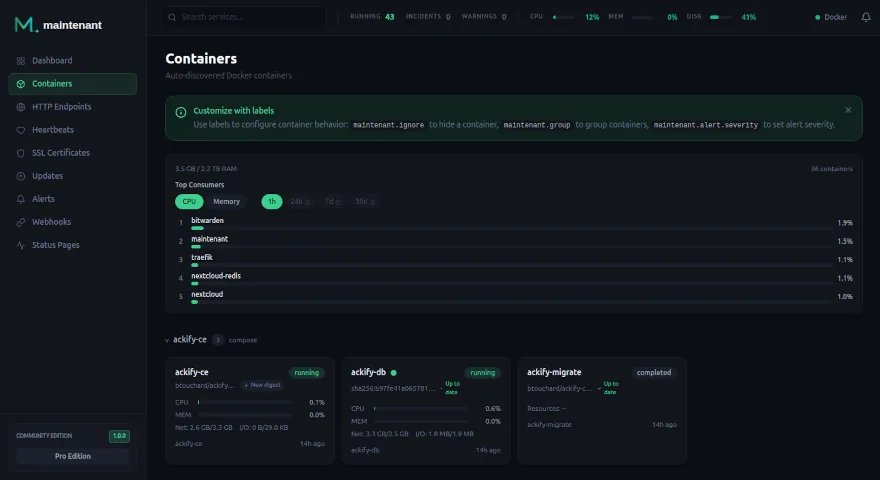
- System resources: the metrics that matter: CPU, RAM, network, disk
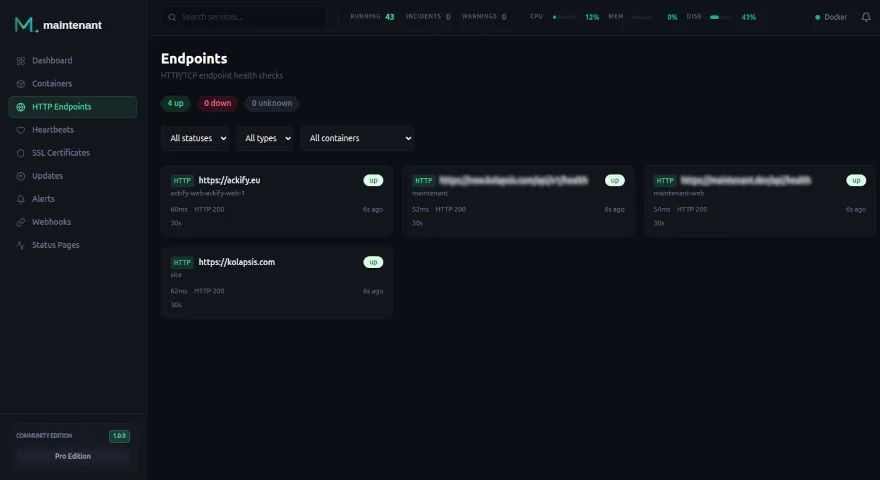
- HTTP/TCP endpoint monitoring: active probing with latency tracking
- SSL certificates, heartbeats, update detection, alerts, status page: all built-in
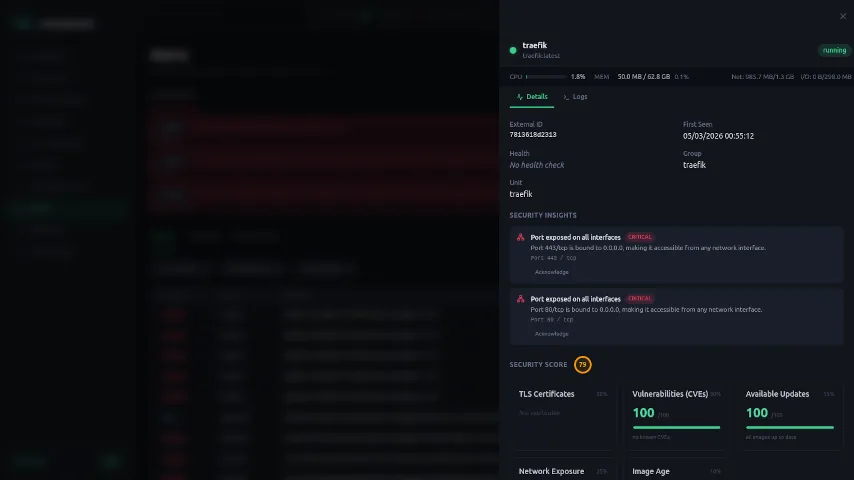
- Network security insights: open ports, exposed services
Migrating from Netdata
Deploy Maintenant, verify it covers your needs, then remove Netdata:
services:
  maintenant:
    image: ghcr.io/kolapsis/maintenant:latest
    ports:
      - "8080:8080"
    volumes:
      - /var/run/docker.sock:/var/run/docker.sock:ro
      - /proc:/host/proc:ro
      - maintenant-data:/data
    environment:
      MAINTENANT_ADDR: "0.0.0.0:8080"
      MAINTENANT_DB: "/data/maintenant.db"
    restart: unless-stopped

volumes:
  maintenant-data:
FAQ
Will I lose visibility by switching from Netdata? You will lose per-second granularity and deep kernel metrics (Netdata is genuinely better at both). You will gain HTTP endpoint monitoring, SSL tracking, cron monitoring, update detection and a public status page, in one container.
Does Maintenant phone home?
Only to send an anonymous usage snapshot: the edition, counts of monitored objects, the OS and architecture, with no hostname, container name or URL. Set MAINTENANT_DISABLE_TELEMETRY=1 and nothing is sent. There is no cloud account, and your monitoring data stays on your server.
Can I run both during a transition? Yes, but be mindful of resource usage: running both temporarily will use even more RAM. We recommend testing on a non-production server first.
Netdata has per-second metrics. How often does Maintenant collect? Maintenant collects container metrics every 10 seconds. For most self-hosted setups, this is more than sufficient. Per-second granularity is mainly useful for performance debugging, which is not Maintenant’s focus.